
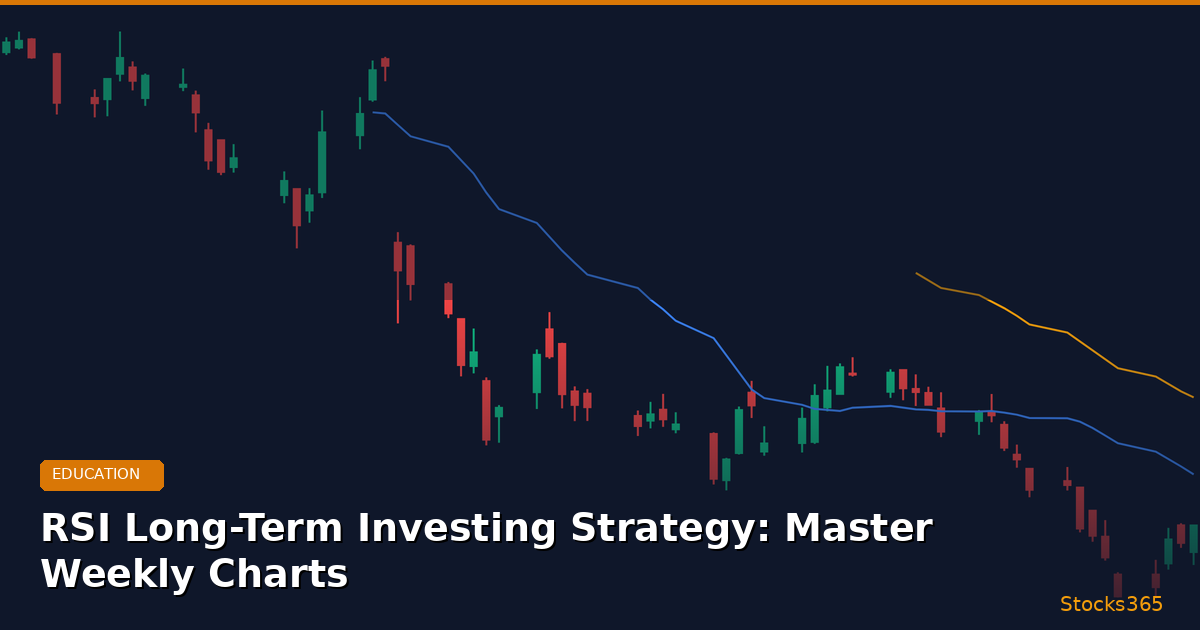
Why RSI Long-Term Investing Is a Game-Changer for Patient Investors
Most traders associate the Relative Strength Index (RSI) with short-term speculation — scalping five-minute charts or riding intraday momentum swings. But here is the truth that separates skilled long-term investors from the crowd: RSI on weekly charts is one of the most powerful, underutilized tools in fundamental and position investors' arsenals.
When you zoom out to the weekly timeframe, the noise disappears. What remains are clean, high-conviction signals that reflect genuine shifts in institutional momentum — the kind of moves that precede multi-month or even multi-year trends. For anyone focused on RSI long-term investing, the weekly chart is your primary battlefield.
In this guide, we will walk through exactly how to apply RSI to weekly charts, which settings work best, how to read divergence across longer timeframes, and how to combine RSI with other confluence factors to make smarter, lower-stress investment decisions. If you are new to the indicator, consider starting with What Is RSI? The Complete Beginner's Guide before diving in.
Key Insight: A single weekly RSI signal represents five full trading days of price action compressed into one data point. That means far fewer false signals, deeper context, and higher statistical reliability than any daily or intraday setup.
Understanding RSI in the Context of Long-Term Timeframes
The RSI is a momentum oscillator that measures the speed and magnitude of recent price changes on a scale of 0 to 100. At its core, it answers a simple question: Is this asset gaining or losing momentum relative to its recent history? If you want to understand exactly how the math works under the hood, our dedicated article on How RSI Is Calculated: Formula Explained Step by Step covers the Wilder smoothing method in full detail.
On a weekly chart, each RSI reading encapsulates a full week of closes. This has several critical implications for long-term investors:
- Fewer whipsaws: Daily RSI can flip between overbought and oversold in days. Weekly RSI moves more deliberately, reducing false entries.
- Institutional footprints: Fund managers and large allocators work on weekly and monthly cycles. Weekly RSI aligns your analysis with where the real money flows.
- Trend identification: Weekly RSI consistently above 50 signals a confirmed uptrend. Below 50 signals a downtrend. This simple rule alone filters out most bad long-term entries.
- Meaningful extremes: When weekly RSI reaches 30 or 70, it genuinely means something — representing weeks or months of sustained selling or buying pressure.
Best RSI Settings for Long-Term Investing on Weekly Charts
The default RSI period is 14, and for weekly charts, this remains the most widely used and respected setting. However, long-term investors sometimes benefit from adjusted periods depending on their strategy horizon.
RSI(14) — The Standard for Weekly Analysis
A 14-period RSI on weekly charts looks back 14 weeks — roughly three and a half months of price data. This is the sweet spot for most position investors. It is sensitive enough to catch meaningful momentum shifts yet smooth enough to ignore temporary volatility spikes.
RSI(21) — For Macro Trend Investors
Some longer-horizon investors prefer a 21-period RSI on weekly charts, effectively looking back five months. This setting produces fewer signals but each one carries even greater weight. It is particularly useful when analyzing large-cap stocks, index ETFs, or commodities where you want only the highest-conviction signals.
RSI(9) — For Swing-Oriented Long-Term Traders
If you are a growth investor who still wants to optimize entries within a broader trend, RSI(9) on weekly charts offers faster responsiveness. The trade-off is slightly more noise. This setting pairs well with a longer-period RSI confirmation — for example, only taking RSI(9) buy signals when RSI(21) is above 50.
For a deeper dive into how period selection affects signal quality across all timeframes, read our full guide: RSI Settings: Master the Best Period for Your Strategy.
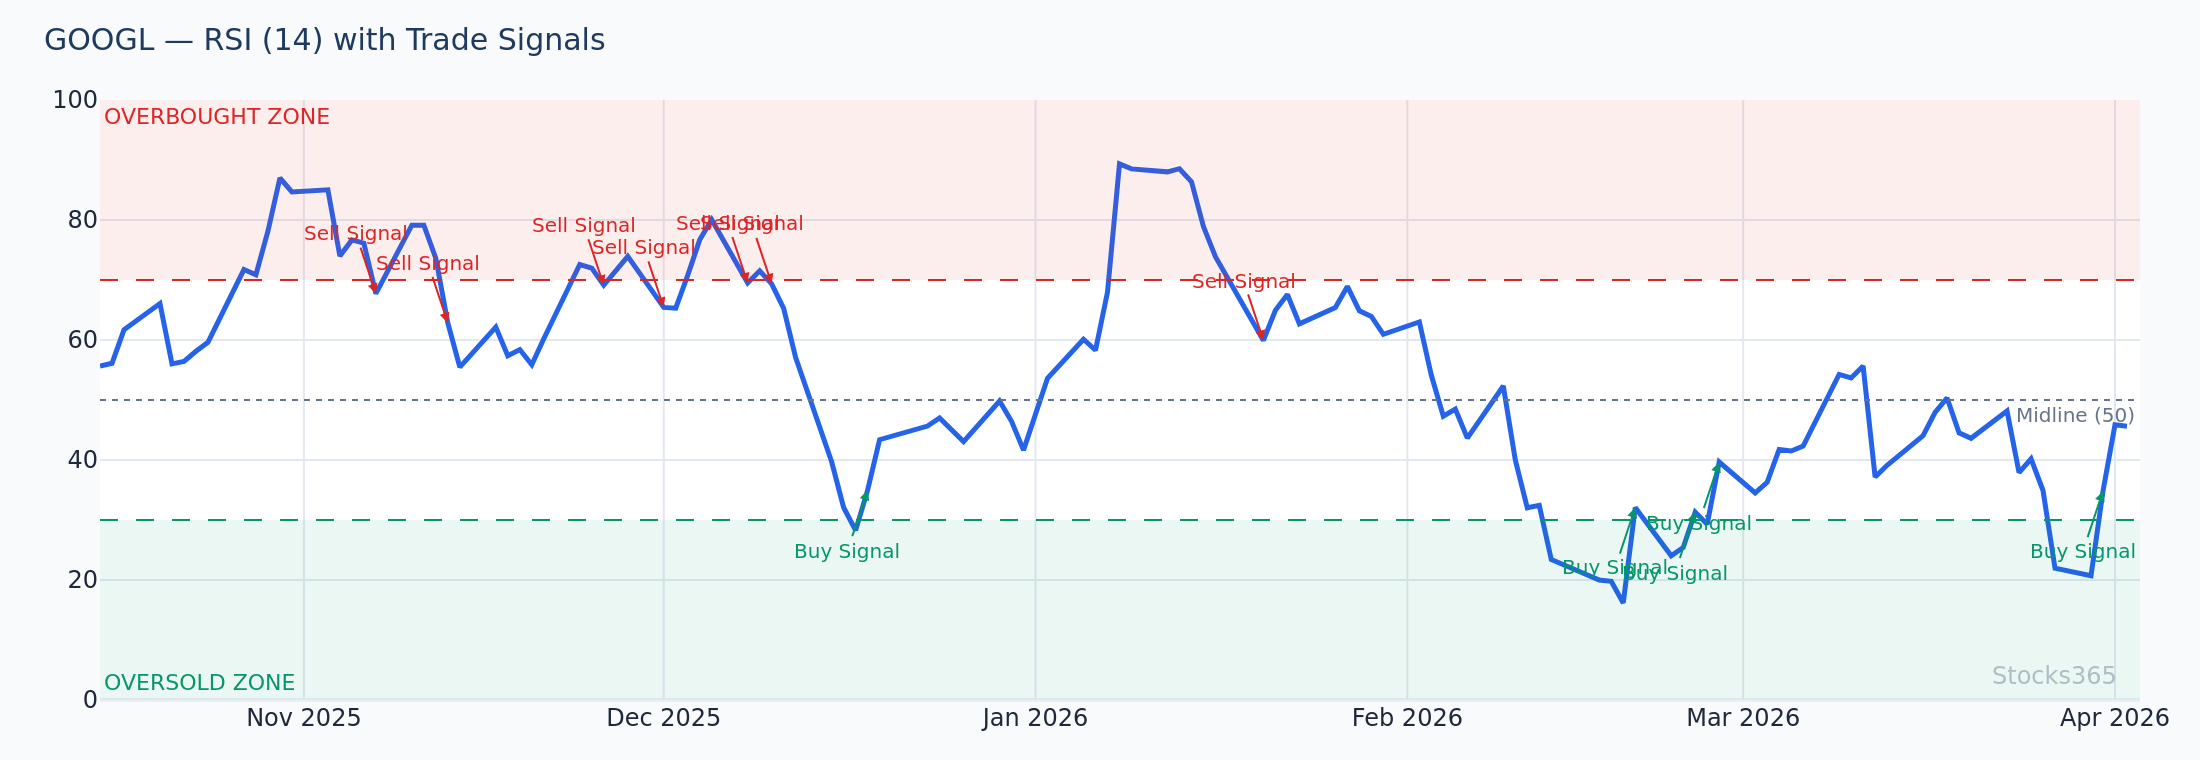
RSI Overbought and Oversold Levels on Weekly Charts
Standard RSI thresholds define overbought as above 70 and oversold as below 30. On weekly charts, these levels take on special significance — and importantly, they must be interpreted differently than on shorter timeframes.
Oversold on Weekly RSI Is a Long-Term Opportunity Signal
When weekly RSI drops below 30, it means weeks of relentless selling. For long-term investors, this is not a warning sign — it is a potential shopping opportunity. Consider this example:
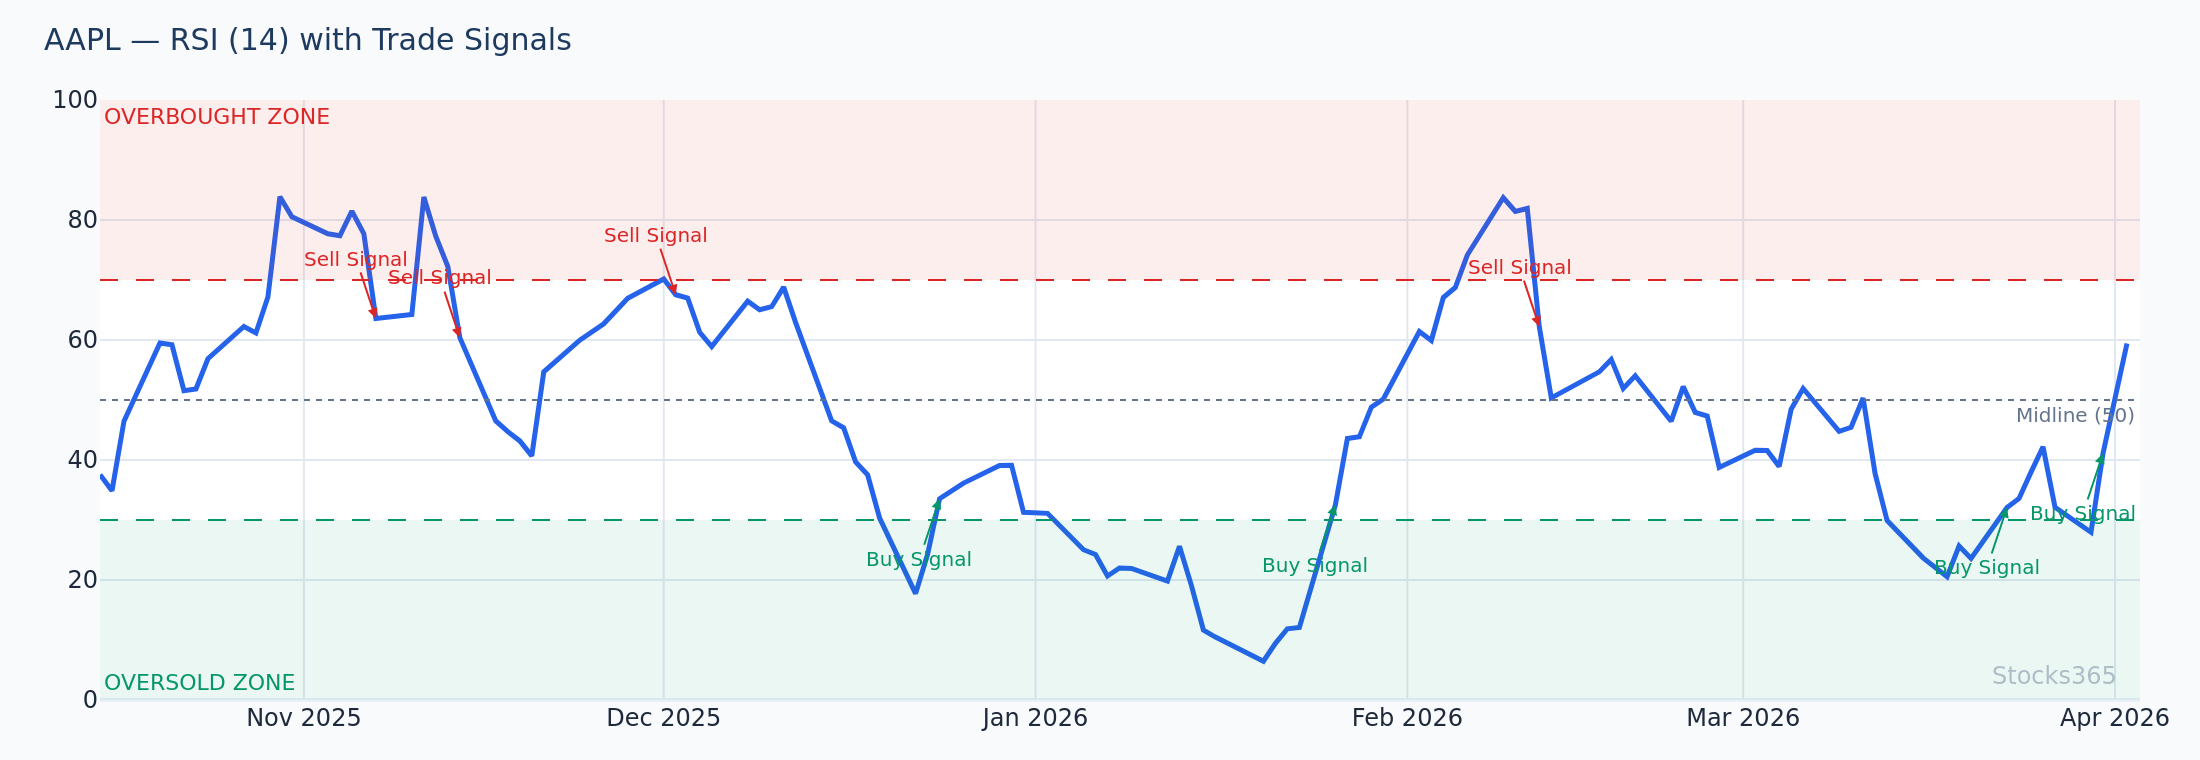
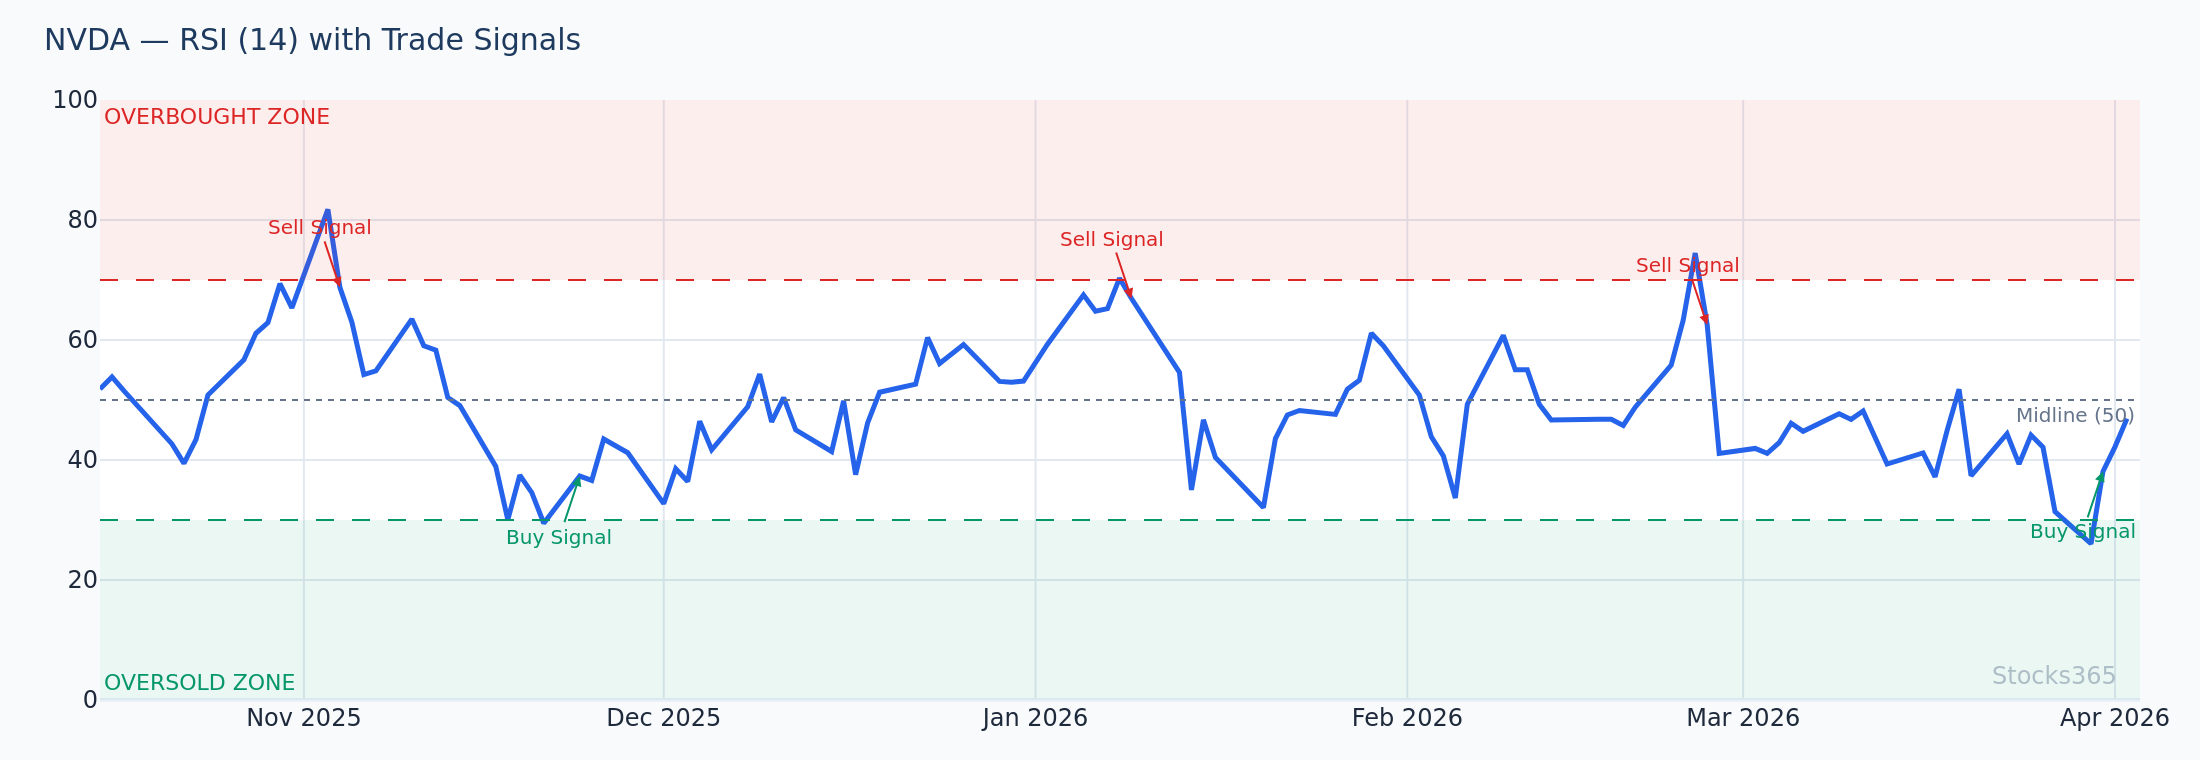
Practical Example — NVDA Weekly RSI, Early 2026: Suppose NVIDIA's weekly RSI drops to 28 after a 35% correction from all-time highs, with the stock trading near $680. For a long-term investor, this oversold weekly reading — combined with strong fundamental support — represents a high-probability accumulation zone. The oversold condition does not mean buy immediately, but it signals that the risk/reward has shifted significantly in the buyer's favor.
The critical nuance: do not confuse oversold with a buy signal in isolation. You want to see the RSI begin to curl upward from the oversold zone — a process called a bullish RSI reversal — before committing capital.
Overbought Weekly RSI — Strength, Not Just a Warning
Here is where many investors make a costly mistake: they sell strong assets simply because weekly RSI crosses above 70. In powerful bull markets, weekly RSI can remain above 70 for months. Assets in structural uptrends spend extended periods in overbought territory. The correct interpretation is context-dependent:
- First cross above 70: Often marks the acceleration phase of a new trend — frequently a continuation signal, not a sell.
- Sustained time above 70 followed by a drop below 70: This is a meaningful warning that momentum is fading — consider tightening stop-losses or reducing position size.
- Second or third visit to overbought with declining price highs: Classic bearish divergence setup — a genuine caution flag for long-term holders.
For the complete framework on interpreting these levels, visit our article on RSI Overbought and Oversold Levels: Master the Signals.
RSI Divergence on Weekly Charts — The Long-Term Investor's Secret Weapon
Of all the RSI techniques available to long-term investors, weekly RSI divergence is arguably the most powerful. Divergence occurs when price and RSI move in opposite directions, signaling that the underlying momentum does not support the current price trend.
Bullish Weekly RSI Divergence
Bullish divergence appears when price makes a lower low but weekly RSI makes a higher low. This pattern, playing out over multiple weeks or months, indicates that selling pressure is exhausting — a genuine bottoming signal that often precedes substantial multi-month rallies.
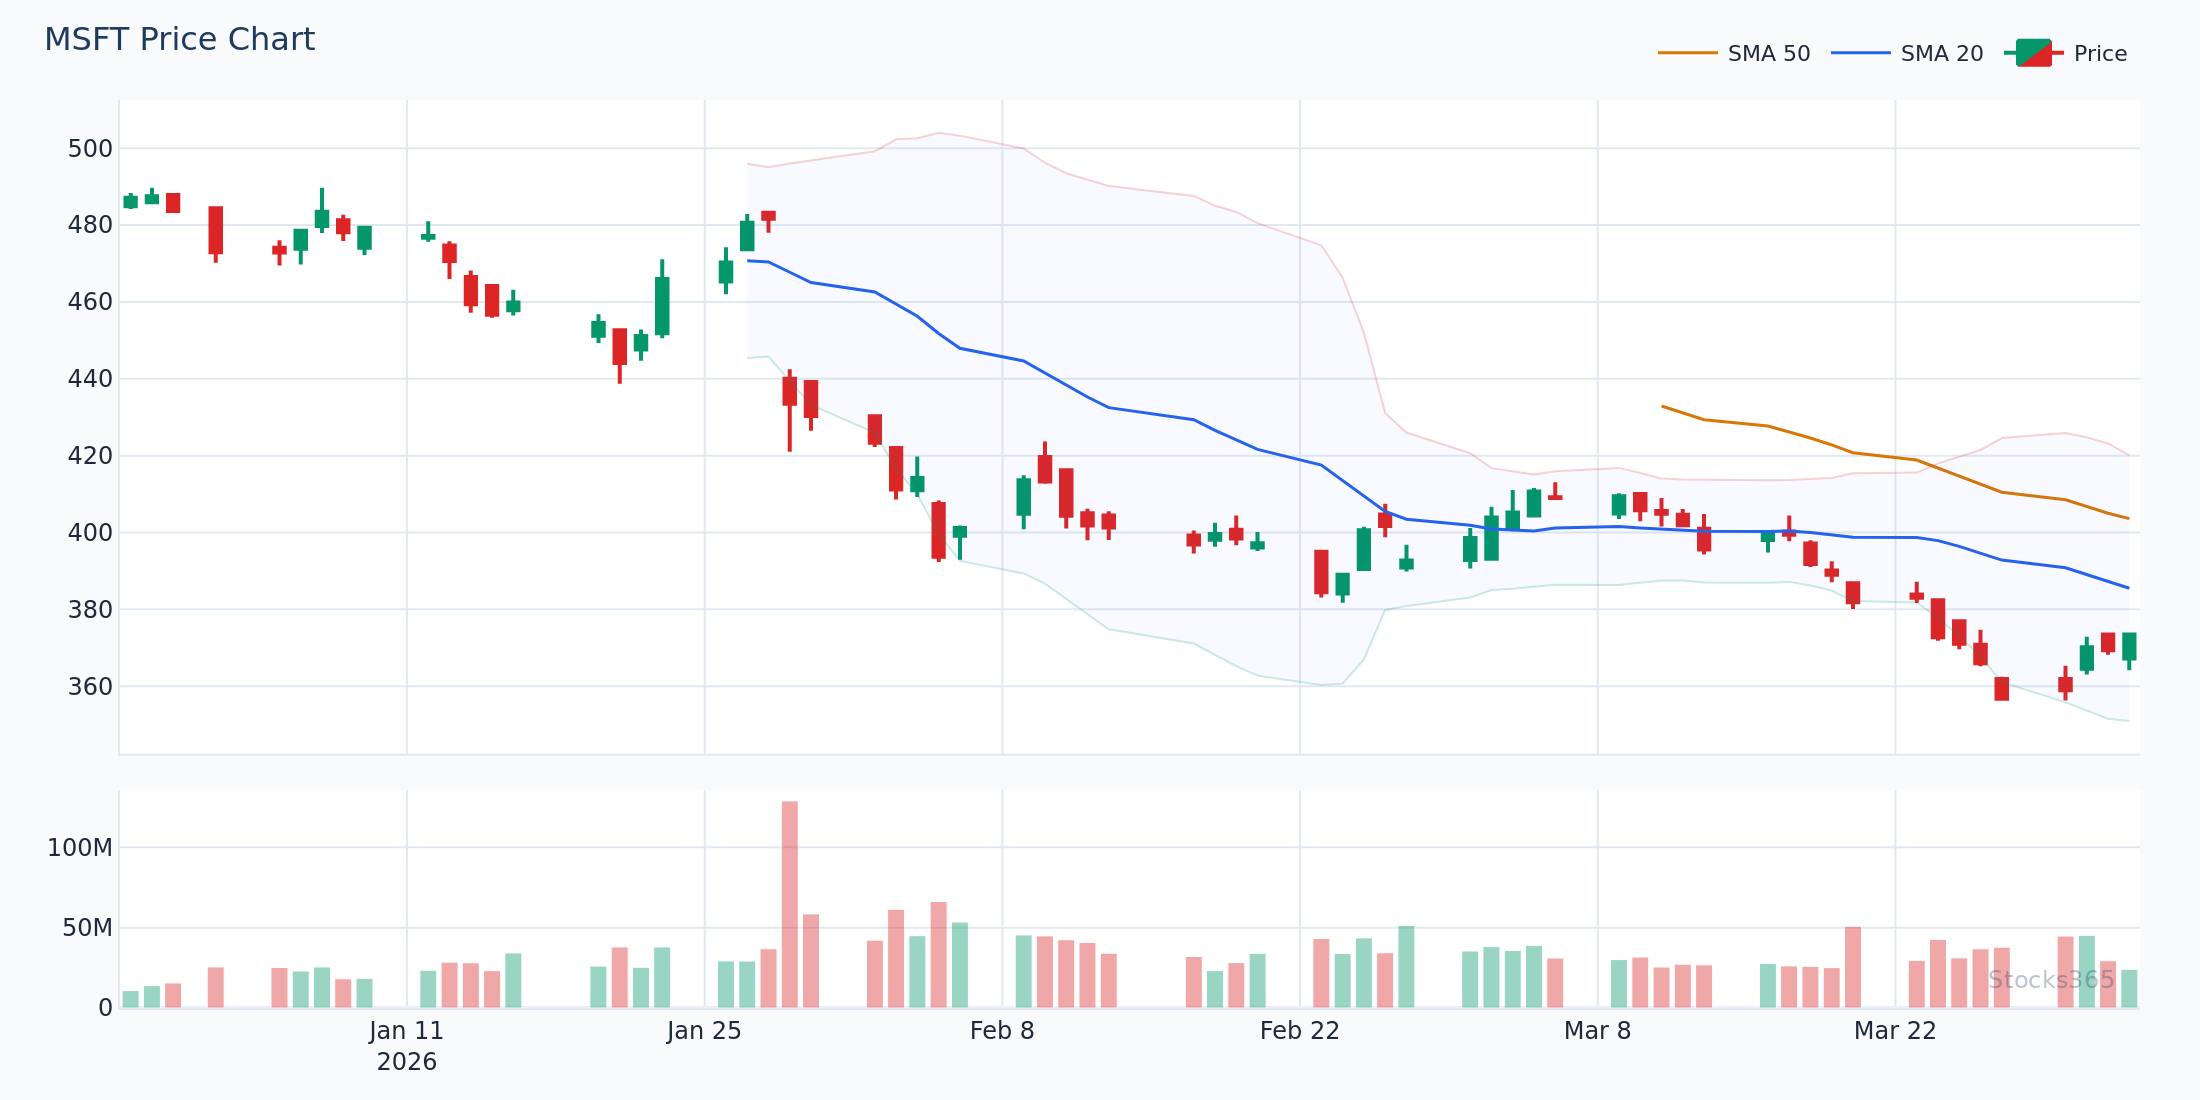
Real-World Example — MSFT Weekly Chart: Imagine Microsoft's stock makes a new 52-week low at $340, but the weekly RSI low is only 34 compared to a prior swing low of 28 weeks earlier. This higher RSI low, despite the lower price, is a textbook bullish divergence setup. A long-term investor who recognizes this pattern has a high-probability entry point with a defined risk level (stop below the price low) and potential upside measured in months, not days.
Bearish Weekly RSI Divergence
The mirror image — price making higher highs while weekly RSI makes lower highs — warns that a trend is running out of steam. For long-term investors who are long a position, this is the signal to begin planning an exit or hedging strategy, not to add exposure.
Practical Example — TSLA Weekly Chart: Tesla rallies from $200 to $320 over six months. The weekly RSI peak during the first push reaches 72, but during the push to $320, RSI only reaches 64. This bearish divergence on the weekly chart, visible across multiple weeks of price action, is a high-conviction warning that the trend is weakening. A long-term holder might use this signal to sell 30-50% of their position and reset at lower prices.
To master both regular and hidden divergence patterns in detail, read our comprehensive articles: RSI Divergence Explained: Master Bullish & Bearish Signals and Hidden RSI Divergence: The Advanced Signal Most Traders Miss.
Building a Complete RSI Long-Term Investing Strategy
Using RSI in isolation is never the goal. The most successful long-term investors use RSI as one layer in a multi-factor decision framework. Here is how to build a robust strategy around weekly RSI signals.
Step 1 — Establish the Macro Trend with Weekly RSI 50 Level
Before anything else, determine which side of the 50 line the weekly RSI occupies:
- Weekly RSI above 50: The stock is in a bullish momentum regime. Look for pullbacks to oversold as buying opportunities.
- Weekly RSI below 50: The stock is in a bearish momentum regime. Avoid new long positions until RSI reclaims 50. Even fundamentally strong companies can trend lower for extended periods.
Step 2 — Identify Weekly RSI Extremes and Reversals
Once you have confirmed the trend direction, watch for RSI reaching an extreme. For long-term buying opportunities:
- Weekly RSI drops below 35-30 (oversold territory)
- RSI begins to curl upward and crosses back above 35
- Price holds above a key weekly support level
- Volume confirms the reversal (expanding on up weeks)
Step 3 — Confirm with Weekly Divergence Analysis
If a RSI extreme coincides with visible bullish divergence across multiple weekly bars, the probability of a successful long-term entry increases dramatically. This convergence of signals — oversold condition plus divergence — is among the highest-quality setups in technical analysis.
Step 4 — Position Sizing and Entry Execution
Long-term investing does not require a single perfect entry. Consider scaling in:
- First tranche (50% of intended position): When weekly RSI crosses back above 30 from oversold territory
- Second tranche (30%): When weekly RSI crosses above 50, confirming trend recovery
- Third tranche (20%): On first meaningful pullback after RSI confirms above 50
Step 5 — Exit Management Using Weekly RSI
Exits are where most long-term investors leave money on the table or give back profits. Weekly RSI guides intelligent profit management:
- Begin reducing exposure when weekly RSI reaches 70+
- Take significant profits when bearish divergence appears on weekly RSI at new price highs
- Exit remaining position if weekly RSI drops back below 50 and cannot reclaim it within 2-3 weeks
For additional context on executing this multi-step approach, our guide on How to Use RSI in Trading: The Ultimate Step-by-Step Guide provides a complementary framework you can adapt for longer timeframes.
RSI vs. Other Long-Term Indicators: Where RSI Wins
Long-term investors often debate whether RSI adds value compared to other momentum and trend indicators. Here is where weekly RSI has a clear edge:
- vs. Moving Averages: Moving averages are lagging indicators — they confirm trends after they begin. Weekly RSI can signal momentum exhaustion or reversal before price visibly turns, giving investors earlier warning.
- vs. MACD: MACD on weekly charts works well for trend following but is slow to identify oversold buying opportunities. RSI excels at identifying extreme conditions that MACD misses.
- vs. Stochastic Oscillator: Both RSI and Stochastic measure momentum, but RSI is generally more stable on weekly charts. Stochastic oscillates faster and produces more signals — useful for shorter timeframes but noisy for long-term positioning. Read the full comparison in our article: RSI vs Stochastic Oscillator: The Essential Guide.
The most effective long-term investors do not choose one indicator over another — they combine weekly RSI with fundamentals, sector analysis, and broader market context for maximum conviction.
Using Stocks365 to Supercharge Your RSI Long-Term Strategy
Manually scanning hundreds of stocks for weekly RSI setups is time-consuming and prone to human error. This is where Stocks365's Trust Score system provides a genuine edge. The platform aggregates multiple technical and fundamental signals — including RSI analysis across multiple timeframes — into a unified confidence rating for each stock.
When a stock's Trust Score aligns with a strong weekly RSI setup (for example, oversold weekly RSI plus bullish divergence plus a high Trust Score), you have quantitative confirmation that the opportunity is multi-dimensional, not just a single indicator fluke.
You can explore live signals and weekly RSI conditions directly on the Stocks365 signals dashboard, or examine individual stock pages like Apple (AAPL) signals to see how current weekly RSI readings factor into the overall analysis.
Common Mistakes in RSI Long-Term Investing (And How to Avoid Them)
Even experienced investors fall into predictable RSI traps on weekly charts. Here are the most common errors and how to sidestep them:
- Treating oversold as an automatic buy: Weekly RSI can stay below 30 for multiple weeks in structurally broken stocks. Always wait for the upturn confirmation.
- Ignoring the 50 line: Buying a stock with weekly RSI at 35 but trending downward, below 50, often means catching a falling knife. The 50 line is your trend filter — respect it.
- Using RSI alone without fundamental context: A stock can be oversold on weekly RSI while simultaneously experiencing deteriorating earnings, rising debt, or losing market share. RSI does not replace fundamental analysis — it complements it.
- Misreading overbought in strong trends: Selling a strong growth stock simply because weekly RSI crosses 70 is a classic mistake. Overbought in a bull trend is often a strength signal, not a sell signal.
- Ignoring divergence: Many investors monitor RSI levels but never look for divergence — the most reliable long-term warning signal. Make divergence analysis a non-negotiable part of your weekly review.
📊 Key Takeaways: RSI Long-Term Investing on Weekly Charts
- Weekly RSI filters noise and aligns your analysis with institutional money flows and multi-month trends.
- RSI(14) is the standard for weekly charts; RSI(21) suits macro investors who want fewer, higher-conviction signals.
- The 50 level is your trend filter — only seek long entries when weekly RSI is above 50 or recovering toward it.
- Oversold weekly RSI (below 30) signals opportunity, but always wait for an upward curl before entering.
- Weekly RSI divergence is among the highest-quality long-term signals available — prioritize it in your analysis.
- Scale into positions using RSI milestones: oversold recovery, 50 reclaim, and pullback confirmation.
- Use Stocks365 Trust Scores alongside weekly RSI to confirm multi-factor setups before committing capital.
Frequently Asked Questions
What RSI level should I look for when buying stocks for long-term investing?
For long-term investing on weekly charts, the most favorable RSI buying zones are typically between 30 and 40 — the oversold-to-recovering range. Specifically, look for weekly RSI that has dropped below 35, then begun to curl upward and cross back above 35. Even better, combine this with bullish RSI divergence and fundamental strength. Avoid entering purely based on oversold readings alone — confirmation of the upward turn is essential.
Is RSI reliable on weekly charts compared to daily charts?
Weekly RSI is generally considered more reliable for identifying significant trend shifts than daily RSI. Each weekly data point represents five sessions of price action, substantially reducing the noise and false signals common on shorter timeframes. For long-term investors, the higher reliability and lower trading frequency of weekly RSI signals makes it better suited to their strategy than daily RSI, which can generate many short-lived, misleading signals.
Can I use RSI alone to build a long-term investing strategy?
RSI alone is not sufficient for a complete long-term investing strategy. It should be used as one component within a broader framework that includes fundamental analysis (earnings growth, competitive position, balance sheet health), sector and macro context, support and resistance levels, and volume analysis. RSI's primary contribution to long-term investing is timing — helping investors identify when momentum supports or undermines a position, and when risk/reward is most favorable for entry or exit.
How long should a weekly RSI signal be valid for long-term investing decisions?
A weekly RSI signal — particularly an oversold reversal or divergence pattern — typically remains actionable for two to four weeks after it first appears, provided price action confirms the setup. If the underlying thesis (RSI recovering, price holding support) remains intact after three to four weeks, the signal is still valid. However, if price breaks below the key support level that anchored your analysis, the signal should be considered invalidated regardless of RSI readings.
How does the Stocks365 platform use RSI in its long-term stock signals?
Stocks365 integrates RSI analysis across multiple timeframes — including weekly charts — as part of its proprietary Trust Score calculation. The platform evaluates current RSI levels, trend alignment relative to the 50 midline, divergence conditions, and momentum trajectory to generate composite signals for each stock. This multi-factor approach means that RSI-based insights are combined with other technical and fundamental metrics, giving long-term investors a more complete and reliable picture than RSI alone could provide. You can explore these signals directly on the Stocks365 dashboard.