
What Is an RSI Stock Screener and Why Does It Matter?
An RSI stock screener is one of the most powerful tools in a trader's arsenal. Rather than manually reviewing hundreds of charts, an RSI screener automatically filters the entire market — or a specific sector — to surface stocks where momentum has reached extreme levels. This gives you a systematic, data-driven edge at the exact moment opportunities emerge.
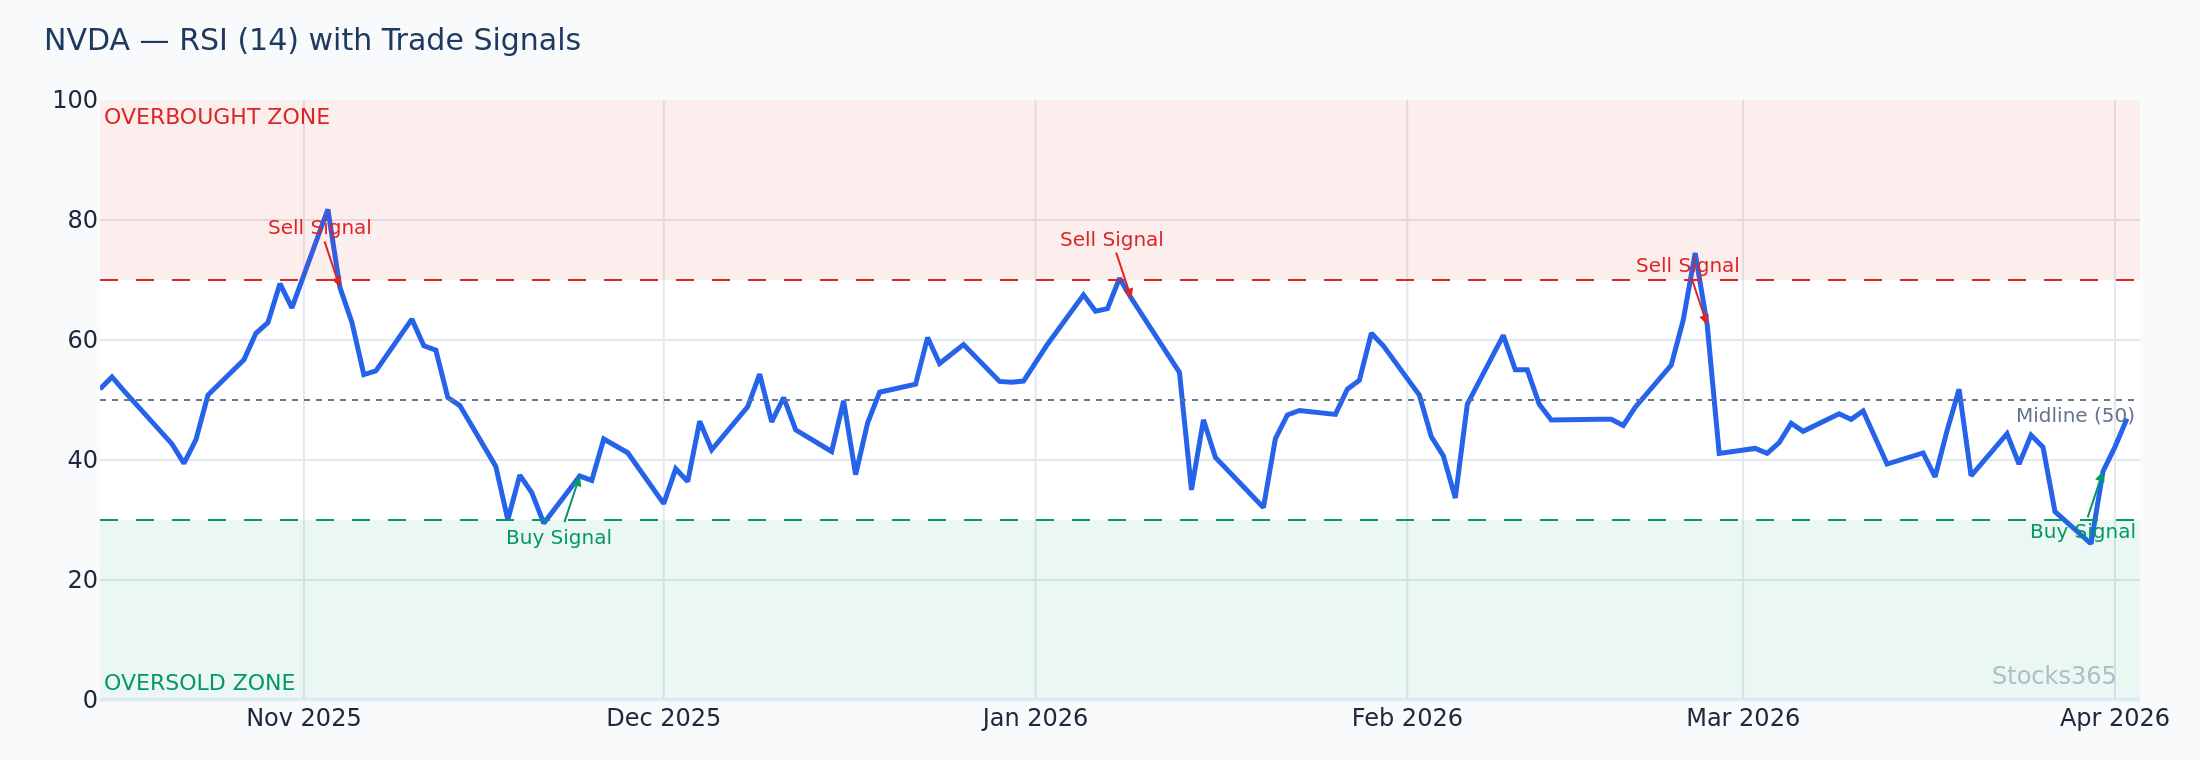
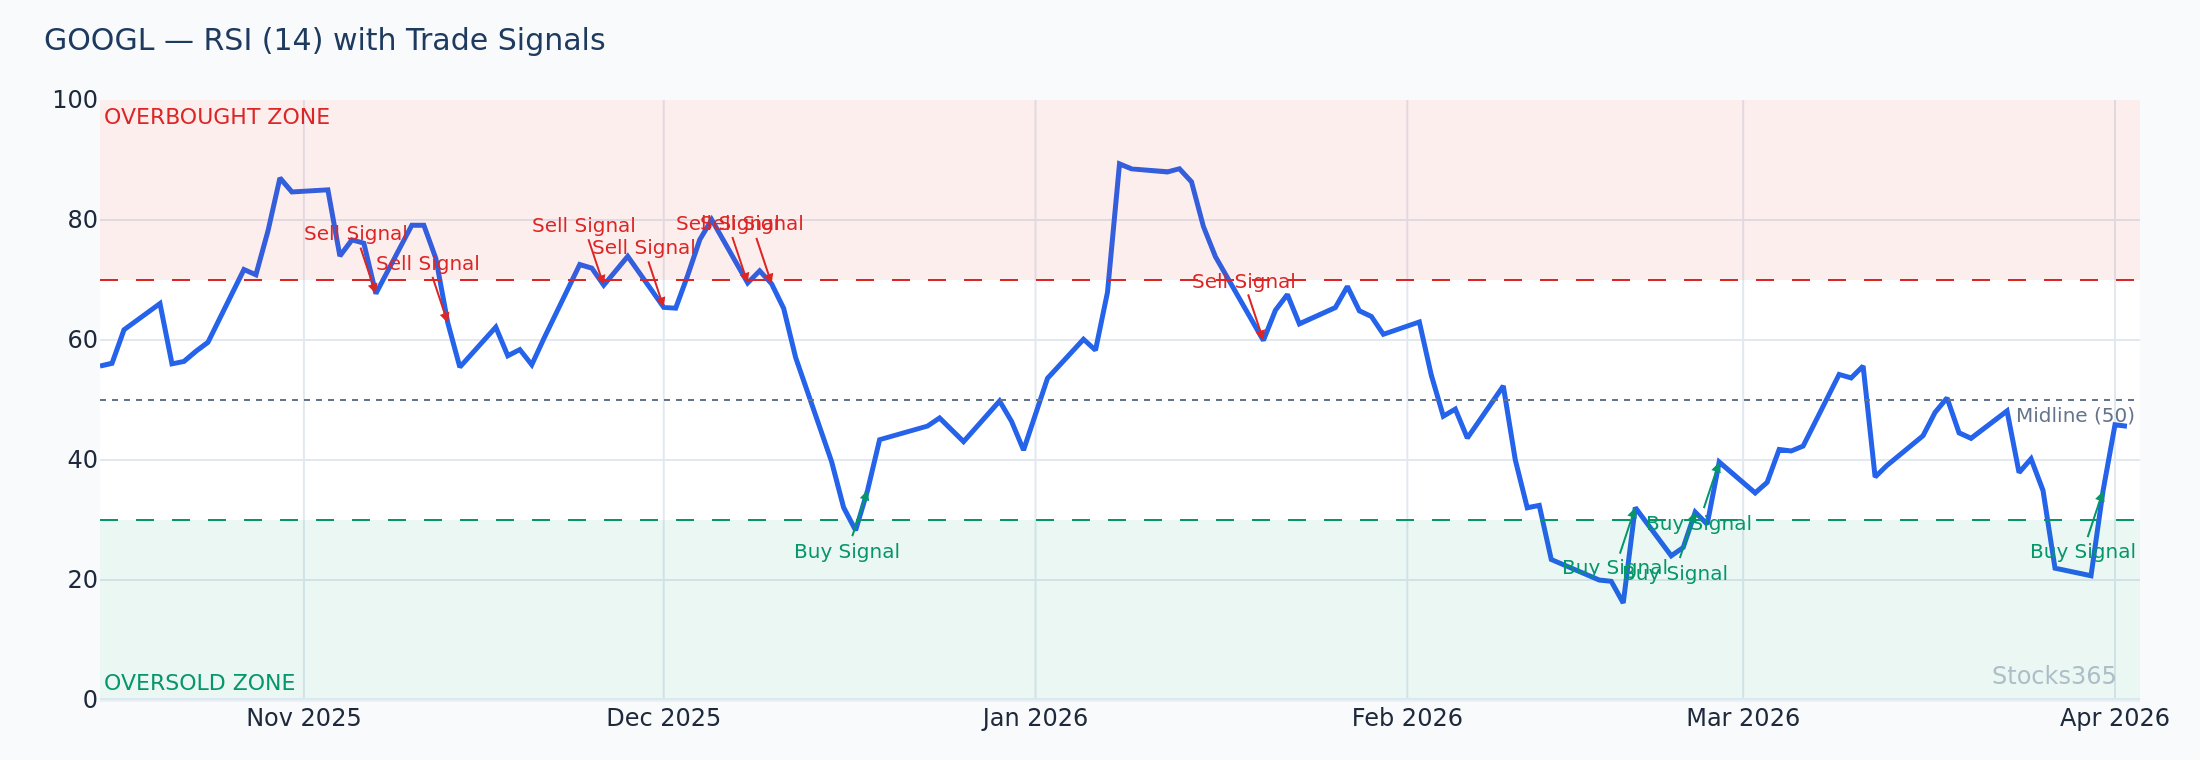
The Relative Strength Index (RSI) is a momentum oscillator that measures the speed and magnitude of recent price changes on a scale of 0 to 100. When RSI drops below 30, a stock is considered oversold — potentially primed for a bounce. When it climbs above 70, it may be overbought — a signal to tighten stops or consider shorting. If you're new to the indicator itself, start with What Is RSI? The Complete Beginner's Guide before diving into screener setups.
In 2026, with algorithmic trading dominating volume and intraday volatility running higher than ever, having a reliable RSI screener isn't optional — it's essential for finding high-probability entries before the crowd catches on.
How RSI Works Inside a Stock Screener
Before building effective filters, you need to understand what the RSI value is actually telling you. The indicator compares the average gains to average losses over a lookback period — typically 14 periods. The result is a single number that represents whether buyers or sellers have had recent control of price action.
Inside an RSI stock screener, you're essentially running this calculation across every stock in a universe simultaneously and filtering by threshold. For example: "Show me all S&P 500 stocks where the 14-day RSI is below 30." In seconds, you have a watchlist of candidates that would take hours to compile manually.
For a deeper understanding of the math behind the signal, see our guide on How RSI Is Calculated: Formula Explained Step by Step. Understanding the formula helps you interpret edge cases — like stocks with extremely low RSI that might be in genuine freefall rather than a temporary dip.
Setting Up Your RSI Stock Screener: Core Filters
The strength of your results depends entirely on how you configure your filters. A screener set too broadly returns noise; too narrow and you miss genuine opportunities. Here's how to build a screener that balances precision with opportunity frequency.
Filter 1: RSI Threshold
The foundational filter is the RSI value itself. The most common setups are:
- RSI below 30 — Classic oversold zone. High probability mean-reversion candidates.
- RSI below 25 — Extreme oversold. Higher potential reward, but also higher risk of continued downtrend.
- RSI crossing up through 30 — Momentum confirmation. The stock is already recovering, reducing the risk of catching a falling knife.
For most swing traders, RSI crossing upward through 30 (rather than simply being below 30) is the superior filter. It adds a confirmation element that dramatically reduces false signals. See our full breakdown of these thresholds in RSI Overbought and Oversold Levels: Master the Signals.
Filter 2: Volume Confirmation
An oversold RSI reading on thin volume is far less meaningful than one accompanied by elevated volume. Add a volume filter requiring today's volume to be at least 1.5x the 20-day average volume. This confirms that the selling pressure creating the oversold condition is significant — and that the subsequent bounce, if it comes, will have real participation behind it.
Filter 3: Price Range
Define a minimum price to avoid penny stocks and illiquid micro-caps that can show extreme RSI readings purely due to low liquidity. A minimum price of $10 (and ideally $20+) combined with a minimum average daily volume of 500,000 shares keeps your screener results actionable.
Filter 4: Market Cap or Index Membership
Narrow your universe for better quality signals. Consider screening within:
- S&P 500 or S&P 1500 — Large and mid-cap stocks with strong institutional interest
- Nasdaq 100 — High-growth tech and innovation names
- Sector ETFs — For targeted sector rotation plays
Stocks with strong institutional ownership tend to revert to the mean more reliably after RSI extremes because professional money managers see the same oversold signal and step in to buy.
The Best RSI Screener Settings for Different Trading Styles
RSI screener settings aren't one-size-fits-all. Your optimal configuration depends on your timeframe and risk tolerance. Choosing the right RSI period is critical — for a full analysis, see RSI Settings: Master the Best Period for Your Strategy.
Day Trading: Fast RSI Screener (5-Period RSI)
Day traders need rapid signals. A 5-period RSI on a 15-minute or hourly chart fires more frequently and captures intraday oversold conditions. Set your threshold at RSI below 20 to filter out weak signals. The trade-off is more noise — so combine with a 9-period EMA trending above the 21-period EMA to ensure you're only taking long entries in stocks with bullish intraday structure.
Example: In early 2026, TSLA experienced a sharp intraday selloff on a tech-sector risk-off day. The 5-period RSI on the 15-minute chart plunged to 16. Traders screening for this condition entered around $285, capturing a $12 intraday bounce as the stock recovered toward the VWAP.
Swing Trading: Classic RSI Screener (14-Period RSI)
The 14-period RSI on the daily chart is the gold standard for swing traders. Screen for RSI below 30 with the additional filter that the stock's price is above its 200-day moving average — this ensures you're buying temporary weakness in a structurally healthy stock rather than a broken downtrend.
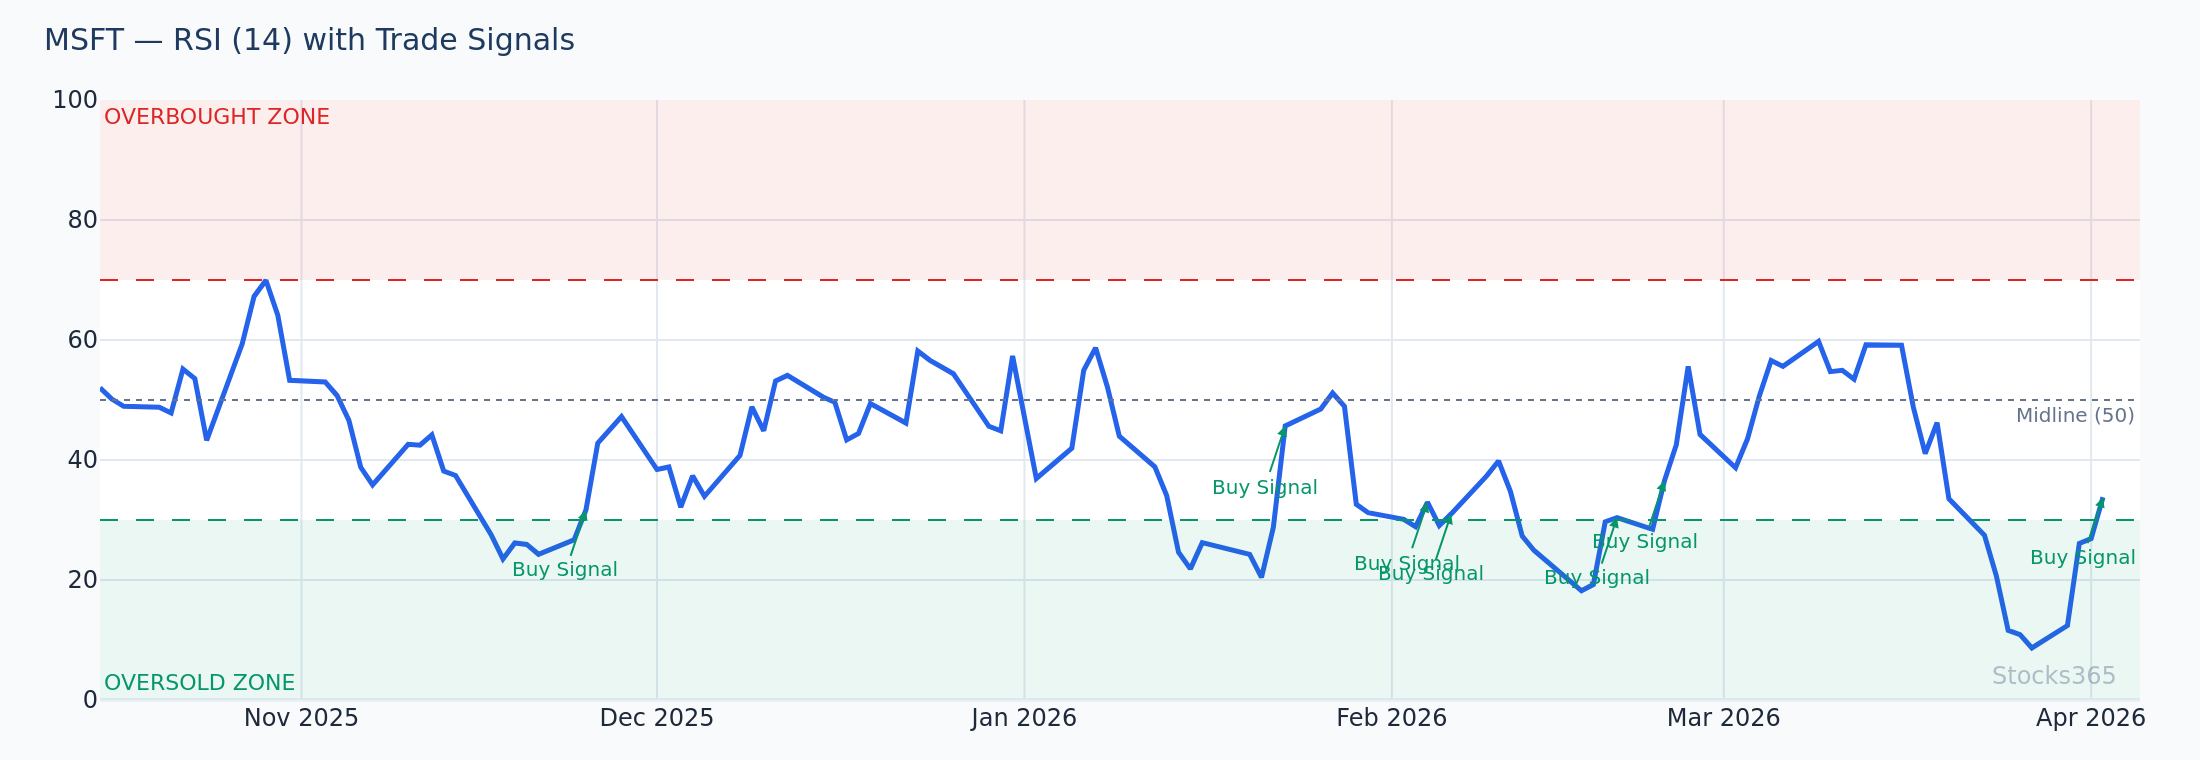
Example: MSFT pulled back sharply in Q1 2026 during a rotation out of mega-cap tech. The daily 14-period RSI fell to 27. Swing traders using an RSI screener caught this entry near $385, with the stock recovering to $420+ over the following three weeks as institutional buyers absorbed the dip.
Position Trading: Slow RSI Screener (21-Period RSI)
Longer-term position traders benefit from a 21-period RSI on the weekly chart. This timeframe filters out short-term noise and only flags truly significant oversold conditions — the kind that often precede multi-month recoveries. Set your threshold at RSI below 35 on the weekly chart to catch these rare but high-conviction setups.
Combining RSI Screener Results with Additional Confirmation
An RSI reading below 30 is a condition, not a buy signal on its own. The most successful traders use the RSI screener to generate a watchlist, then apply additional confluence filters before executing a trade. Here's the confirmation checklist used by professional traders on the Stocks365 platform:
1. RSI Divergence Confirmation
Bullish RSI divergence — where price makes a lower low but RSI makes a higher low — is one of the most powerful confirmation signals available. When your screener flags an oversold stock and divergence is present, your probability of a successful reversal trade increases substantially. Dive deep into this technique with our guide on RSI Divergence Explained: Master Bullish & Bearish Signals.
For even more advanced confirmation, check for hidden bullish divergence as explained in Hidden RSI Divergence: The Advanced Signal Most Traders Miss — a signal many retail traders overlook entirely.
2. Support Level Confluence
Oversold RSI readings are most actionable when they occur at or near a key technical support level. Look for:
- Prior swing lows
- 50-day or 200-day moving average
- Fibonacci retracement levels (38.2%, 50%, 61.8%)
- High-volume price nodes from volume profile analysis
When an oversold RSI reading coincides with a confluence of support levels, the risk-to-reward ratio improves dramatically because your stop loss can be placed just below support with a clearly defined level.
3. Candlestick Reversal Patterns
Before entering, wait for a reversal candlestick pattern to confirm the bounce is beginning. Look for:
- Hammer or inverted hammer — Long lower wick showing buyers rejected lower prices
- Bullish engulfing — Current candle fully engulfs the prior red candle's body
- Morning star — Three-candle reversal pattern with a small indecision candle in the middle
4. Stocks365 Trust Score
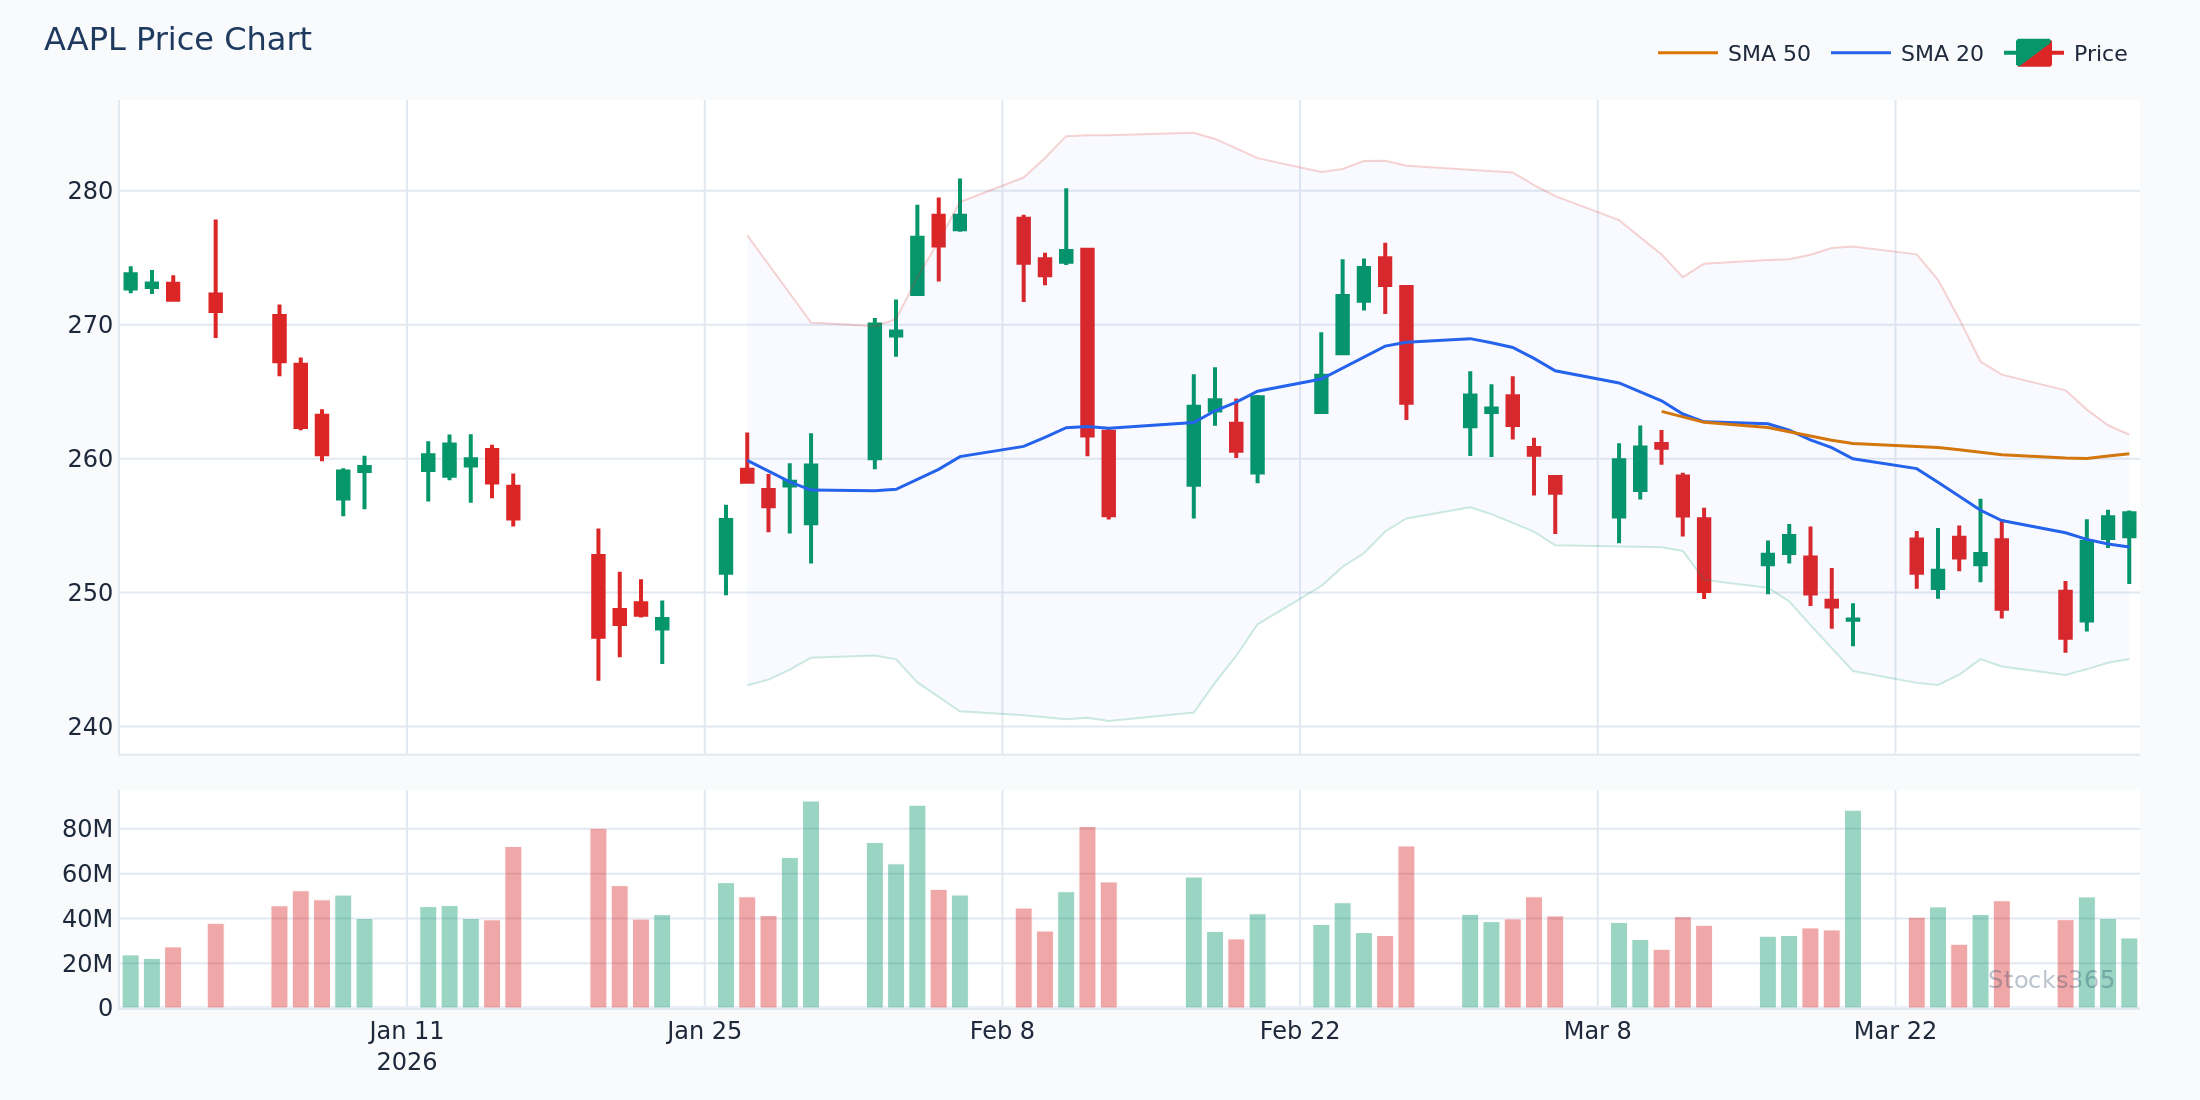
On the Stocks365 signals dashboard, each screener result is accompanied by a Trust Score — a proprietary composite rating that weighs RSI signal strength, volume confirmation, trend alignment, and institutional activity into a single actionable score. Higher Trust Score signals (80+) have historically demonstrated stronger follow-through, making it easy to prioritize your watchlist. For example, checking the AAPL signal page shows you not just the current RSI reading but the full multi-factor confidence rating.
RSI Screener vs. Stochastic Screener: Which Is Better?
A common question among traders is whether to screen using RSI or the Stochastic Oscillator. Both measure overbought/oversold conditions but with important differences. RSI compares a stock's performance to its own history, making it particularly effective for trending stocks. The Stochastic Oscillator measures closing price relative to the high-low range, making it sensitive to recent momentum shifts.
For most equity screeners, RSI tends to generate cleaner, less noisy signals — especially on daily and weekly timeframes. However, combining both in a screener (requiring both RSI below 30 and Stochastic %K below 20) can reduce false signals significantly. Explore this comparison in depth: RSI vs Stochastic Oscillator: The Essential Guide.
Avoiding the Biggest RSI Screener Mistakes
Even traders who understand RSI conceptually make costly errors when using a screener. Here are the most common pitfalls and how to avoid them:
Mistake 1: Buying Every Oversold Reading
In a strong downtrend, RSI can remain below 30 for extended periods. A stock can be oversold at $50 and become more oversold at $30. Always check the broader trend context before acting. Require that the stock's 50-day moving average be above its 200-day moving average (golden cross) for long-only oversold plays, or at minimum that the stock isn't making successive lower lows with no signs of stabilization.
Mistake 2: Ignoring Sector Context
An oversold RSI reading in a sector that is under fundamental pressure (regulatory headwinds, collapsing earnings) is far less reliable than the same reading in a sector experiencing temporary profit-taking. Always check the sector ETF's RSI alongside the individual stock.
Mistake 3: Using Only One Timeframe
A stock can be oversold on the daily chart but overbought on the weekly chart. This multi-timeframe conflict reduces the probability of a sustained bounce. The highest-probability RSI screener setups show oversold conditions aligning across at least two timeframes — for example, both the daily and the 4-hour chart are below RSI 30 simultaneously. This technique is covered in detail in our guide on How to Use RSI in Trading: The Ultimate Step-by-Step Guide.
Mistake 4: No Stop Loss Plan
A screener finds the entry. You must define the exit before you enter. For oversold RSI trades, a common approach is to place a stop loss 2-3% below the most recent swing low and target the most recent swing high or the 20-day moving average as a first profit target.
Step-by-Step: Running Your First RSI Stock Screener Scan
Here's a complete walkthrough of a professional-grade RSI screener setup you can implement today:
- Step 1: Open the Stocks365 signals dashboard and select the RSI screener module.
- Step 2: Set your universe to S&P 500 or Nasdaq 100 for quality-filtered results.
- Step 3: Apply RSI filter: 14-period RSI crossing above 30 (upward cross) on the daily chart.
- Step 4: Add volume filter: Today's volume > 1.5x 20-day average volume.
- Step 5: Add trend filter: Price above 200-day simple moving average.
- Step 6: Sort results by Trust Score (highest first) to prioritize the strongest signals.
- Step 7: For each result, check the individual signal page (e.g., AAPL) to review multi-timeframe alignment and divergence indicators.
- Step 8: Wait for a bullish candlestick confirmation on the daily chart before entering.
- Step 9: Set stop loss below the prior swing low and define your first profit target.
Pro Tip: Run your RSI screener scan at market close each day, not during market hours. End-of-day RSI values are final and confirmed. Intraday RSI readings can shift significantly in the final hour of trading, leading to false signals if you act too early.
Key Takeaways
- An RSI stock screener automates the process of finding oversold (and overbought) stocks across large universes in seconds.
- The most reliable filter is RSI crossing upward through 30 on the daily chart — confirmation that selling momentum is reversing.
- Always combine RSI screener results with volume confirmation, support levels, candlestick patterns, and multi-timeframe alignment for higher-probability trades.
- Different trading styles require different RSI periods: 5-period for day trading, 14-period for swing trading, 21-period for position trading.
- Avoid the common mistake of buying every oversold reading — always check the broader trend context and sector environment.
- The Stocks365 Trust Score on the signals dashboard helps you prioritize the strongest RSI screener results quickly.
- RSI screeners work best when integrated into a complete trading system with defined entries, stop losses, and profit targets.
Frequently Asked Questions
What RSI level means a stock is oversold?
The traditional threshold is RSI below 30, as defined by RSI creator J. Welles Wilder. However, in strong bull markets, RSI rarely drops below 40, so some traders use RSI below 40 as their oversold threshold in trending environments. For extreme oversold conditions, RSI below 20 or 25 signals more significant capitulation. Learn more about these thresholds in our guide on RSI Overbought and Oversold Levels: Master the Signals.
Can an RSI screener be used for short selling?
Absolutely. An RSI stock screener is equally effective for finding overbought short-selling candidates. Simply reverse the filter — screen for RSI above 70 (or RSI crossing back below 70 for confirmation), combined with high volume and price below the 50-day moving average. Apply the same confirmation rules: look for bearish candlestick patterns, resistance level confluence, and bearish RSI divergence before entering a short position.
How often should I run an RSI stock screener?
For swing traders, running your RSI screener once per day at market close is sufficient. End-of-day values are confirmed and provide the clearest signals. Day traders may run 15-minute or hourly RSI scans throughout the session. Avoid running scans in the first 30 minutes of market open when volatility is highest and RSI readings are least stable.
What's the difference between RSI screener and momentum screener?
A momentum screener typically identifies stocks with the strongest recent price performance — essentially finding what is already working. An RSI screener does the opposite for oversold setups: it finds stocks that have experienced temporary weakness despite potential underlying strength. Both have their place in a complete trading strategy. RSI screeners excel at mean-reversion and dip-buying strategies, while pure momentum screeners suit trend-following and breakout approaches.
Is a 14-period RSI the best setting for screening?
The 14-period RSI is the most widely used setting and works well for swing trading daily charts. However, the "best" period depends on your trading style. Shorter periods (5-9) generate more signals with more noise, while longer periods (21-28) generate fewer but higher-conviction signals. For a complete analysis of RSI period settings and how to choose the right one for your strategy, read RSI Settings: Master the Best Period for Your Strategy.