
RSI vs Bollinger Bands: Which Indicator Should You Use?
When traders argue about the best technical indicators, two names consistently rise to the top: the Relative Strength Index (RSI) and Bollinger Bands. Both are battle-tested, widely adopted, and genuinely useful — but they measure entirely different things. Understanding the distinction between RSI vs Bollinger Bands isn't just academic; it's the difference between trading with clarity and trading with confusion.
In this comprehensive guide, we'll break down how each indicator works, where each excels, where each falls short, and — most importantly — how combining them can give you a serious edge in today's markets.
Key Insight: RSI measures momentum and price strength, while Bollinger Bands measure volatility and price range. They're not competitors — they're complements.
What Is RSI? A Quick Recap
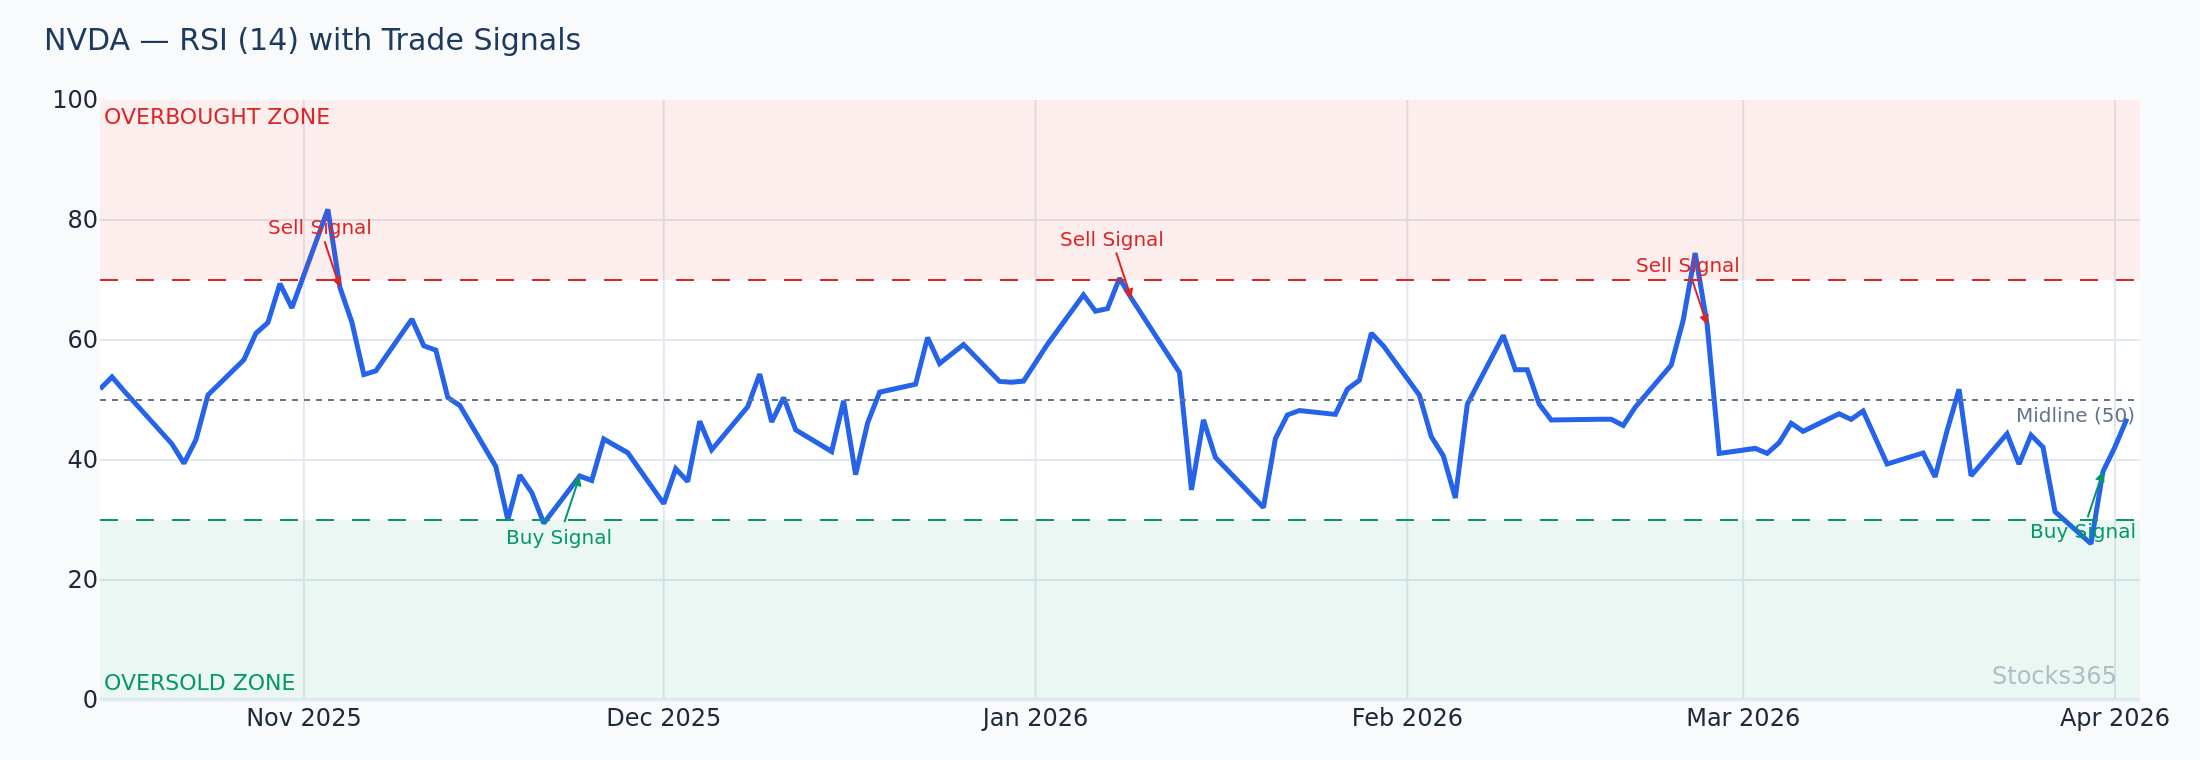
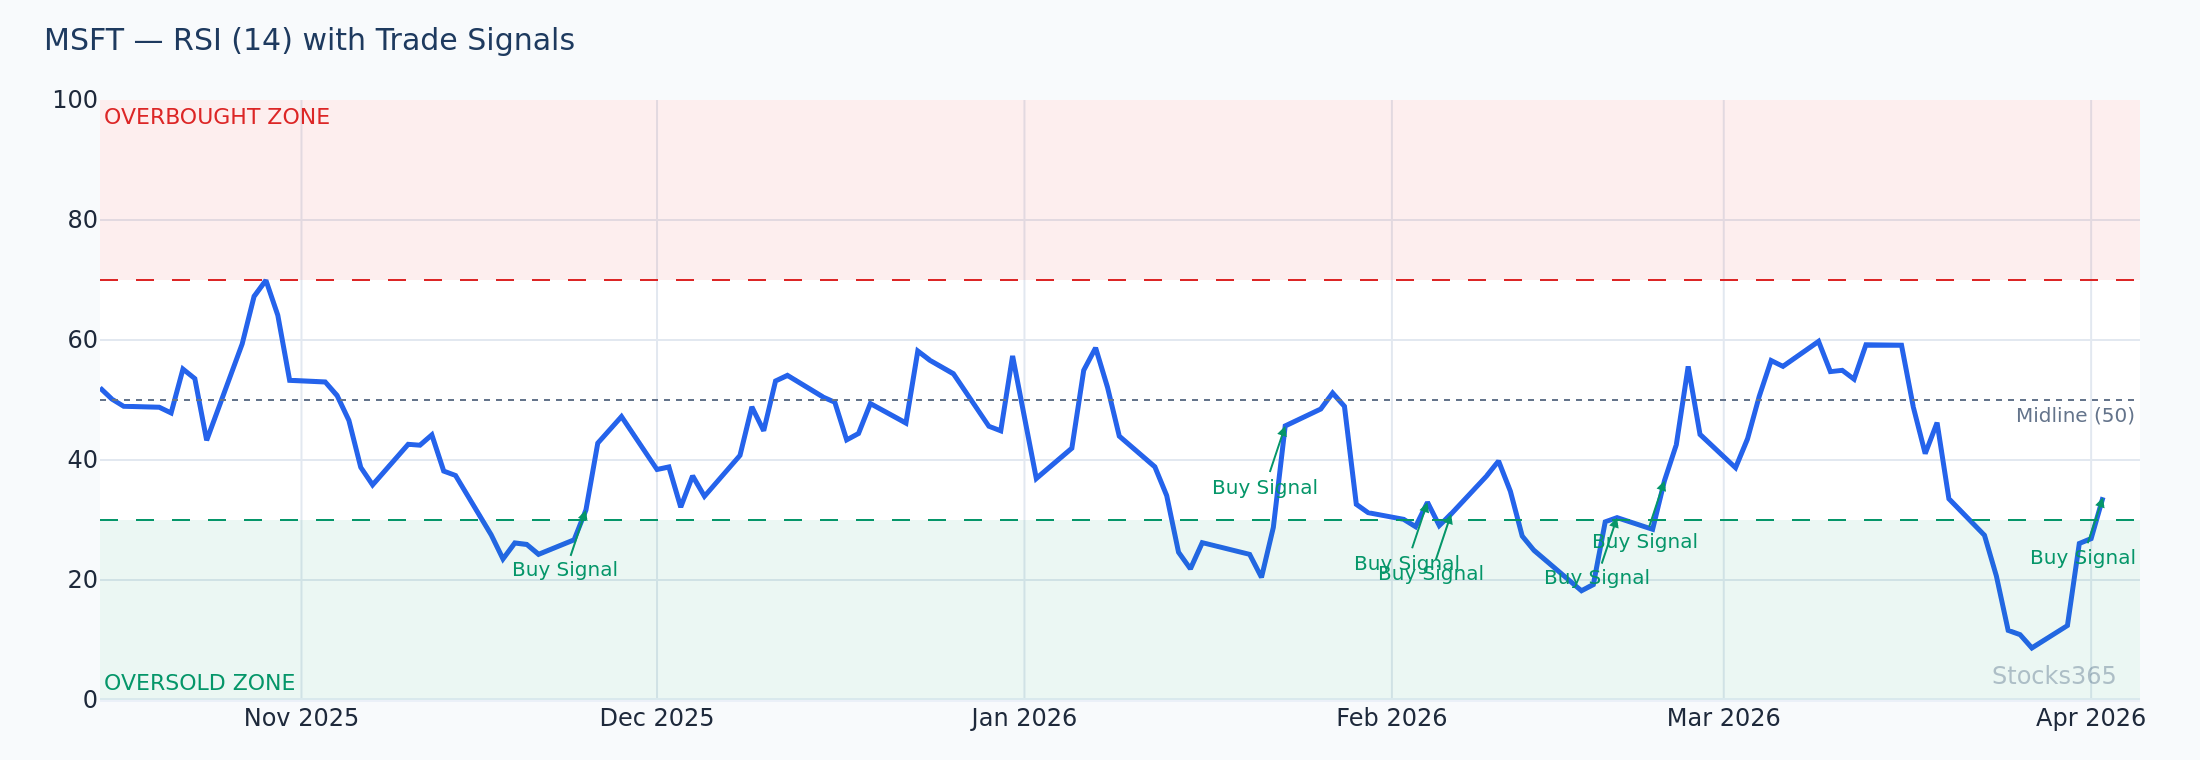
The Relative Strength Index is a momentum oscillator developed by J. Welles Wilder Jr. It moves on a scale of 0 to 100 and tells you how fast and how much a price has moved over a defined period — typically 14 periods. When RSI climbs above 70, the asset is considered overbought. When it drops below 30, it's considered oversold.
If you're new to RSI, our Complete Beginner's Guide to RSI covers the fundamentals in depth. For a deeper understanding of the math behind it, check out our article on How RSI Is Calculated: Formula Explained Step by Step.
RSI is fundamentally asking: Is the recent price move gaining or losing strength? It's a momentum-first tool — which means it excels in trending environments but can give false signals during sideways, choppy markets.
What Are Bollinger Bands? A Quick Recap
Bollinger Bands, created by John Bollinger in the 1980s, consist of three lines plotted directly on the price chart:
- Middle Band: A simple moving average (typically 20-period SMA)
- Upper Band: Middle band + 2 standard deviations
- Lower Band: Middle band − 2 standard deviations
The bands expand when volatility increases and contract when volatility decreases. Statistically, roughly 95% of price action should occur within the bands, assuming normal distribution. When price touches or breaks the upper band, the asset may be overextended to the upside. When it touches the lower band, it may be overextended to the downside.
Bollinger Bands are asking: Is the current price unusual relative to recent volatility? That's a fundamentally different question than what RSI asks — and that's why combining both indicators is so powerful.
RSI vs Bollinger Bands: Core Differences Explained
1. What They Measure
This is the most important distinction in the RSI vs Bollinger Bands debate:
- RSI measures momentum — the speed and magnitude of recent price changes. It compares average gains to average losses over a lookback period.
- Bollinger Bands measure volatility — how wide or narrow price swings have been recently, and whether the current price is statistically extreme.
Because they measure different market dimensions, they generate different — and often complementary — signals.
2. Where They Appear on a Chart
- RSI is a separate pane indicator — it plots below your main price chart as an oscillator between 0 and 100.
- Bollinger Bands are an overlay indicator — they plot directly on the price candles themselves.
This means Bollinger Bands give you an immediate visual context around price action, while RSI requires you to glance at a separate panel. Neither approach is superior — they simply serve different visual purposes.
3. Sensitivity to Market Conditions
- RSI performs best in trending markets. In a strong uptrend, RSI can stay above 70 for extended periods, confirming trend strength rather than signaling a reversal. Learn how to adjust RSI for different environments with our guide on RSI Settings: Master the Best Period for Your Strategy.
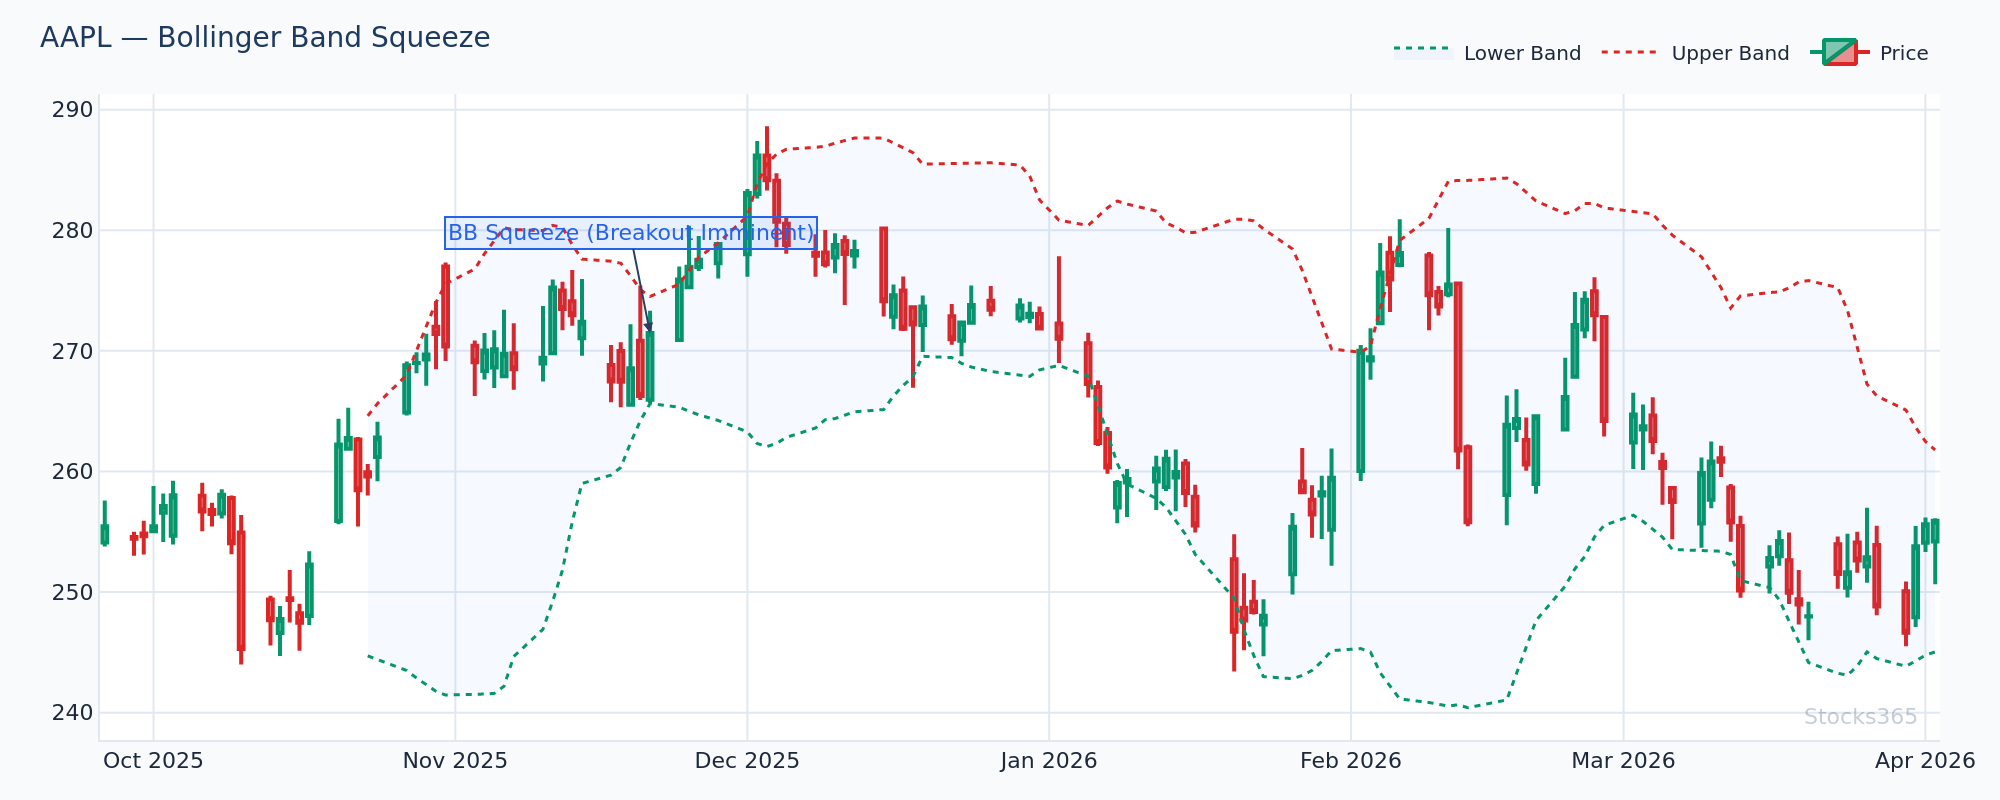
- Bollinger Bands adapt automatically to current volatility conditions. A Bollinger Squeeze — when the bands narrow dramatically — is one of the most reliable signals of an imminent explosive move, regardless of direction.
4. Signal Types Generated
RSI generates:
- Overbought/oversold readings (above 70, below 30)
- Bullish and bearish divergences
- Centerline (50) crossovers to confirm trend direction
- Hidden divergences for trend continuation
Bollinger Bands generate:
- Band touch/break signals (price at upper or lower band)
- Squeeze setups (contracting bands = pending volatility expansion)
- Walking the band (price hugging the upper or lower band in a trend)
- Mean reversion signals (price returning to the middle band)
RSI Strengths: When It Has the Edge
RSI is the superior tool in several specific scenarios:
Identifying Divergence — RSI's Killer Feature
One of RSI's most powerful capabilities is divergence detection. When price makes a new high but RSI fails to confirm it with a corresponding high, that's a bearish divergence — a warning that momentum is fading before price confirms it. The reverse is bullish divergence.
For example, in early 2026, when TSLA rallied to $380 but RSI peaked at 68 (below its previous high of 74), that bearish divergence preceded a meaningful pullback — exactly the kind of edge RSI divergence can offer. Explore this concept further in our detailed guide on RSI Divergence Explained: Master Bullish & Bearish Signals.
Bollinger Bands simply cannot produce this type of signal. Divergence analysis is exclusively an RSI (and momentum oscillator) strength.
Quantifying Momentum Strength
RSI gives you a precise numerical reading. An RSI of 78 tells you something different from an RSI of 52 — you can quantify how overbought or oversold conditions are. Bollinger Bands are more visual and less numerically precise in this regard.
Hidden Divergence for Trend Trading
Advanced traders use hidden RSI divergence to stay in trends longer. When price pulls back to a higher low but RSI drops to a lower low, that's a hidden bullish divergence — confirming the uptrend is intact. This is a concept Bollinger Bands cannot replicate. Read our guide on Hidden RSI Divergence: The Advanced Signal Most Traders Miss to master this technique.
Bollinger Bands Strengths: When They Have the Edge
Volatility Context — Bollinger Bands' Killer Feature
Bollinger Bands automatically adjust to market volatility. When NVDA's bands contracted to their tightest range in months during a consolidation phase in Q1 2026, the subsequent breakout was explosive — the bands had already telegraphed that a major move was building. RSI would have simply shown a neutral reading around 50.
This Bollinger Squeeze setup is uniquely powerful because it identifies low-volatility coiling before high-volatility expansion, giving traders time to position before the move begins.
Visual Price Context
Because Bollinger Bands overlay directly on price, traders can immediately see whether the current candle is at the upper band ($195.40), the middle band ($183.20), or the lower band ($171.00) — all at a glance, without switching to a separate indicator pane. This spatial relationship between price and bands is intuitively powerful.
Dynamic Support and Resistance
The middle Bollinger Band (the 20-period SMA) often acts as dynamic support in uptrends and dynamic resistance in downtrends. The upper and lower bands provide dynamic extreme levels. RSI has no equivalent to this price-level functionality.
Mean Reversion Trading
In range-bound markets, when price touches the lower Bollinger Band and begins to turn, traders have a clear mean reversion target: the middle band (SMA), and potentially the upper band. Bollinger Bands make mean reversion strategies visually intuitive in a way RSI alone cannot match.
The Real Winner: Combining RSI and Bollinger Bands
The RSI vs Bollinger Bands debate creates a false choice. The real edge comes from using both together. Here's why: when both indicators align, signal confidence increases dramatically.
The Double-Confirmation Entry Strategy
Consider this setup on AAPL in March 2026:
- Price touches the lower Bollinger Band at $198.50
- Simultaneously, RSI drops to 28 (oversold territory)
- A bullish candlestick pattern forms at the lower band
- Stocks365 Trust Score shows strong institutional accumulation signals
When price is at the lower Bollinger Band and RSI is oversold at the same time, you have two independent indicators confirming the same thing: the market is stretched to the downside. That's a high-probability mean reversion setup.
The reverse applies to the short side: price touching the upper Bollinger Band + RSI above 70 = double confirmation of an overbought condition.
Bollinger Squeeze + RSI Momentum Confirmation
When Bollinger Bands squeeze (contracting bands signal low volatility), watch RSI for directional clues. If RSI begins moving above 50 as the squeeze resolves, it confirms the developing breakout is to the upside. If RSI falls below 50, the breakout is likely downward.
This combination — Bollinger Bands for the when and RSI for the direction — is exceptionally powerful.
Divergence Within the Bands
Perhaps the most powerful combination: RSI bearish divergence occurring while price is walking the upper Bollinger Band. This signals that while the trend looks strong (upper band walk), internal momentum is fading (divergence) — a premium warning signal that a reversal may be imminent.
RSI vs Bollinger Bands: Practical Comparison Table
Here's a structured breakdown of how RSI and Bollinger Bands compare across key trading criteria:
- Primary Function: RSI = Momentum | Bollinger Bands = Volatility
- Chart Placement: RSI = Separate pane | Bollinger Bands = Price overlay
- Best Market Condition: RSI = Trending | Bollinger Bands = Both trending and ranging
- Divergence Signals: RSI = Yes | Bollinger Bands = No
- Volatility Measurement: RSI = No | Bollinger Bands = Yes
- Mean Reversion Targets: RSI = Limited | Bollinger Bands = Strong
- Squeeze Detection: RSI = No | Bollinger Bands = Yes
- Complexity: RSI = Moderate | Bollinger Bands = Moderate
Common Mistakes When Using RSI vs Bollinger Bands
Mistake 1: Using Either Indicator in Isolation
Relying solely on RSI overbought/oversold readings without context is dangerous — in a strong uptrend, RSI can stay above 70 for weeks. Relying solely on Bollinger Band touches without momentum confirmation leads to premature entries. Use both together.
Our guide on RSI Overbought and Oversold Levels: Master the Signals dives deep into how to correctly interpret these readings in context.
Mistake 2: Ignoring the Trend
Both indicators can give misleading signals when traded against the primary trend. RSI at 30 in a strong downtrend is not necessarily a buy signal — it can simply mean the downtrend is accelerating. Always establish trend context first.
Mistake 3: Not Adjusting Settings
Default RSI settings (14 periods) and default Bollinger Band settings (20 SMA, 2 standard deviations) work well as starting points, but may need adjustment for your specific timeframe and instrument. Shorter RSI periods (9-11) increase sensitivity; longer periods (21+) reduce noise.
Mistake 4: Over-Optimizing
Curve-fitting your RSI or Bollinger Band settings to past data creates false confidence. Stick to widely-used defaults and focus on confluence with price action rather than finding the "perfect" settings.
How Stocks365 Integrates RSI and Bollinger Bands into Trading Signals
At Stocks365, our signals dashboard combines RSI readings, Bollinger Band positioning, and several other technical factors into a unified Trust Score for each trade setup. Rather than manually checking each indicator, our system surfaces high-probability setups where multiple signals align — including both RSI extremes and Bollinger Band positioning simultaneously.
For example, when reviewing the AAPL signal page, you can instantly see whether the current RSI reading supports the Bollinger Band signal — and whether the overall confluence score justifies a trade. This multi-indicator approach is exactly how professional traders think about RSI and Bollinger Bands: not as rivals, but as a team.
If you want to go deeper on using RSI effectively in your overall strategy, our Ultimate Step-by-Step Guide to Using RSI in Trading is the most comprehensive resource available. You might also find value in our comparison of RSI vs Stochastic Oscillator to understand how RSI stacks up against another popular momentum tool.
Key Takeaways
RSI vs Bollinger Bands — Summary:
- ✅ RSI measures momentum and is best for identifying overbought/oversold conditions, divergences, and trend strength confirmation
- ✅ Bollinger Bands measure volatility and are best for identifying price extremes, squeeze setups, and dynamic support/resistance levels
- ✅ Neither indicator is universally superior — they serve different analytical purposes
- ✅ The most powerful approach combines both: Bollinger Band extremes + RSI confirmation = high-probability signals
- ✅ Bollinger Squeeze + RSI direction is one of the most reliable breakout strategies available
- ✅ RSI divergence at Bollinger Band extremes is a premium reversal signal
- ✅ Always consider trend context — both indicators perform differently in trending vs. ranging markets
Frequently Asked Questions
Is RSI or Bollinger Bands better for day trading?
For day trading, Bollinger Bands often have a slight edge because they provide immediate visual context around intraday price action and their squeeze signals work well on shorter timeframes like 5-minute or 15-minute charts. However, RSI remains invaluable for confirming momentum direction. The best day trading approach uses both: Bollinger Bands to identify the setup and RSI to confirm the entry direction.
Can I use RSI and Bollinger Bands together on the same chart?
Absolutely — and this is highly recommended. Bollinger Bands appear as an overlay directly on your candlestick chart, while RSI appears in a separate panel below. They don't compete for visual space, and together they provide both volatility context (Bollinger Bands) and momentum confirmation (RSI) simultaneously. Many professional trading platforms, including Stocks365, display both by default for exactly this reason.
What does it mean when RSI is overbought but price is below the upper Bollinger Band?
This is an important nuance: RSI overbought (above 70) without price touching the upper Bollinger Band suggests strong momentum but not necessarily an extreme price stretch. The market may be moving quickly upward (RSI confirms strength) but hasn't yet reached a statistically unusual price level (Bollinger Band not touched). This condition often indicates a trend in its early-to-middle stages rather than an immediate reversal candidate. Wait for price to also reach the upper Bollinger Band before treating it as a high-confidence reversal setup.
Which indicator is better for swing trading — RSI or Bollinger Bands?
For swing trading (holding positions for days to weeks), RSI divergence signals tend to offer the highest-value setups, as they can identify trend exhaustion before price confirms it — giving swing traders time to position. That said, Bollinger Band squeeze setups on daily charts are equally powerful for catching swing breakouts. Ideal swing trading strategy: use RSI for timing entries and divergence spotting, use Bollinger Bands for identifying the volatility context and setting price targets (often the opposite band).
Do professional traders use RSI, Bollinger Bands, or both?
Professional and institutional traders typically use both indicators as part of a broader toolkit rather than relying on either exclusively. What separates professional usage from retail usage is context: professionals apply RSI and Bollinger Bands with trend analysis, volume confirmation, and multi-timeframe analysis rather than using them as standalone buy/sell signals. The Stocks365 Trust Score system mirrors this professional approach by combining multiple technical signals — including RSI and Bollinger Band readings — into a unified confluence score for each trading opportunity.