
Stochastic Oscillator Crossover Strategy: The Complete Trading Guide
The stochastic oscillator crossover is one of the most widely used signals in technical analysis. And one of the most misused. Traders slap it on a chart, see the %K cross the %D line, and fire off an order — only to watch price keep moving against them. Done right, this strategy produces consistent, repeatable setups. Done wrong, it's just noise.
This guide covers everything: how the crossover works, which market conditions favor it, how to stack confirmation signals, and when to walk away. We'll also share real backtested data from Stocks365's multi-year strategy sweep so you're working with evidence, not theory.
Stocks365 backtested 8,204 stochastic oversold signals across equities, forex, crypto, and commodities and found a 54.7% win rate with a profit factor of 1.24 over a 10-day holding period. That edge is real — but it's not evenly distributed. How you filter those signals determines whether you're on the right side of that edge or the wrong one.
What Is a Stochastic Oscillator Crossover?
The stochastic oscillator measures where price closes relative to its range over a lookback period — typically 14 periods. It outputs two lines:
- %K — the fast line, reacting quickly to price changes
- %D — a smoothed moving average of %K, usually a 3-period SMA
A stochastic oscillator crossover occurs when %K crosses above or below %D. A bullish crossover happens when %K moves above %D. A bearish crossover happens when %K drops below %D.
The crossover becomes a tradeable signal — not just a line intersection — when it occurs inside the overbought zone (above 80) or the oversold zone (below 20). That's the filter most beginners miss entirely.
For a deep dive into the math behind these lines, read our guide on how the stochastic oscillator works and its formula explained.
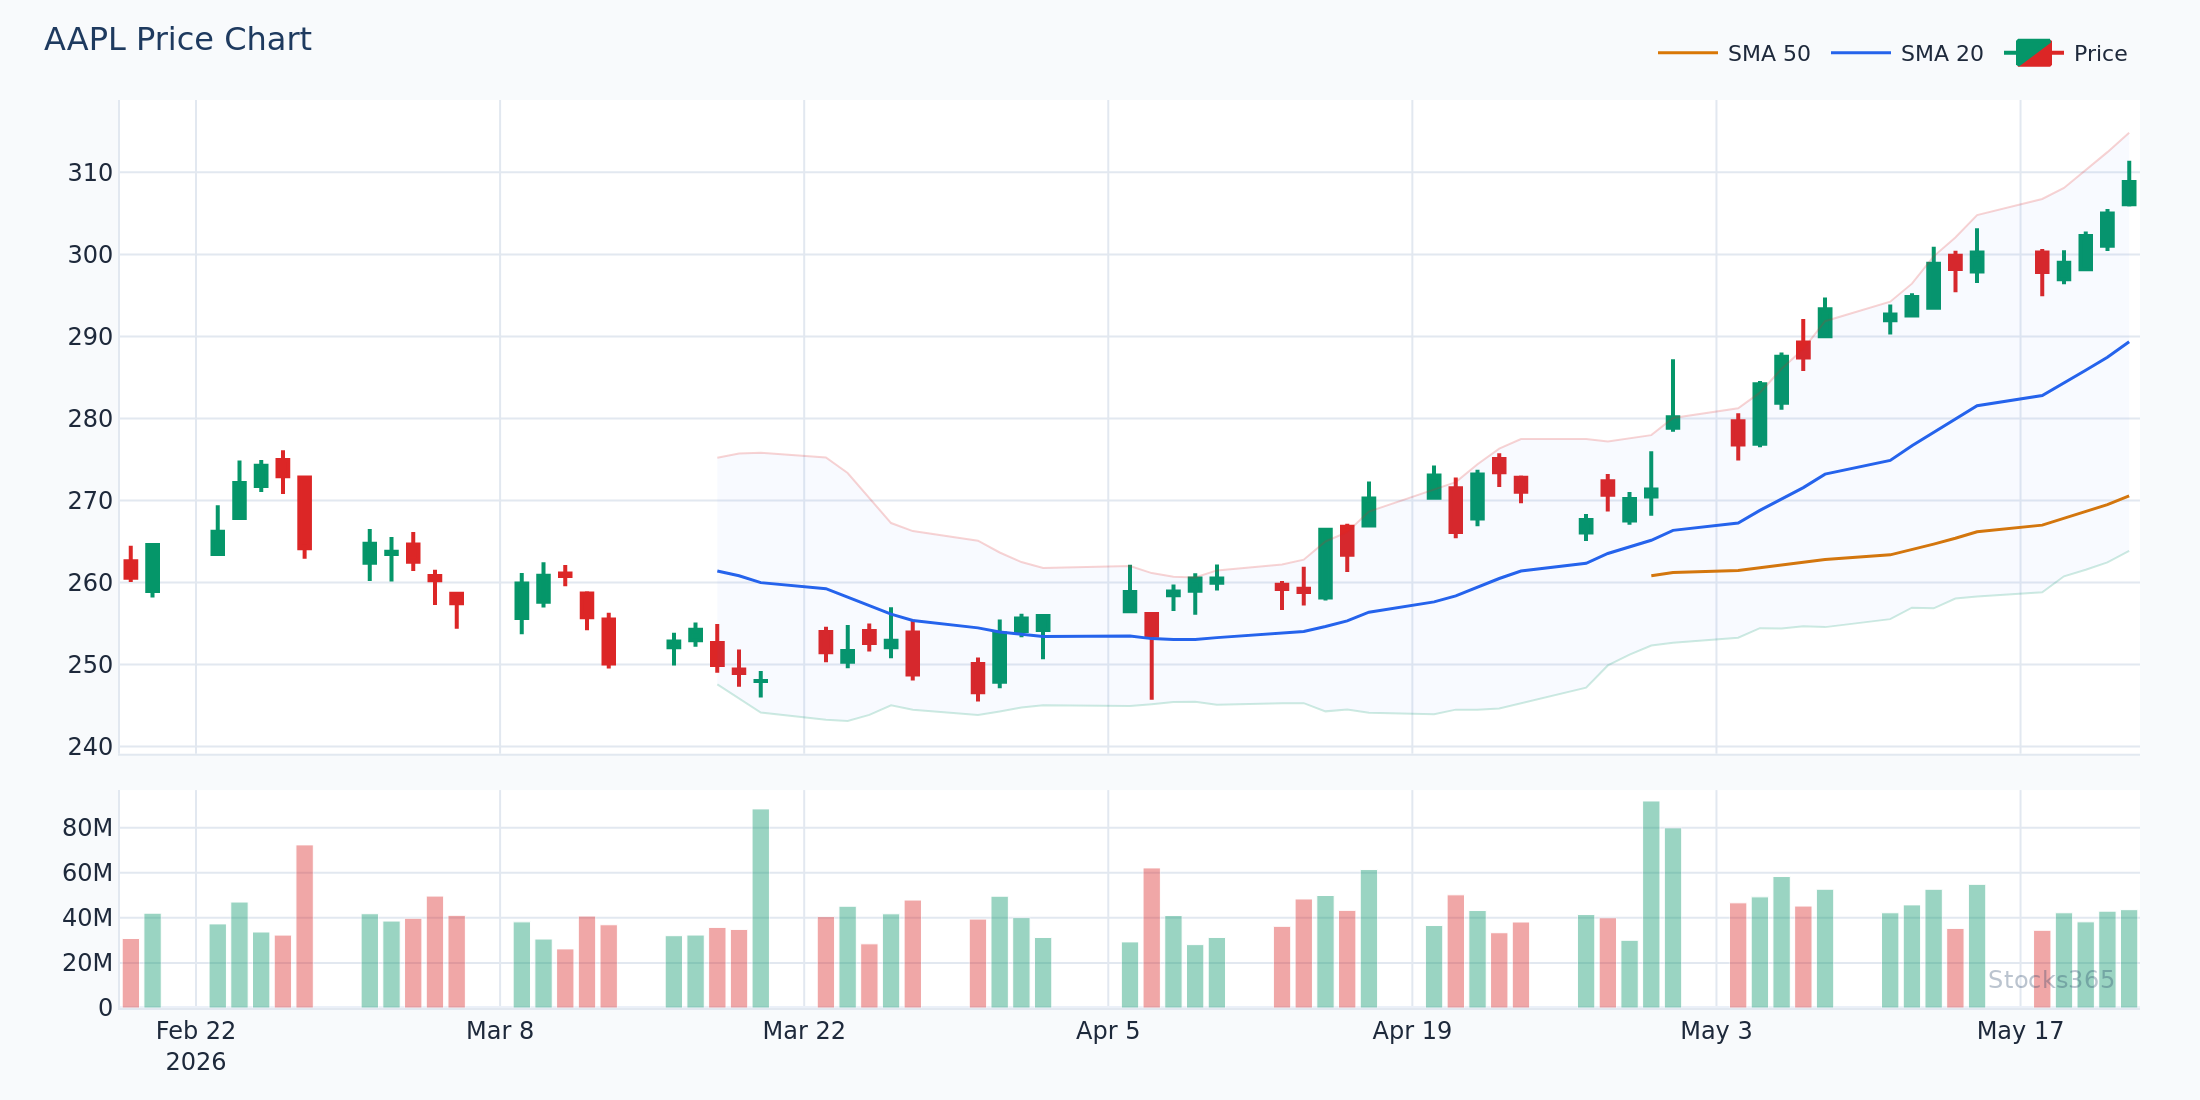
This chart shows a classic bullish crossover setup: %K dipping below 20, then crossing back above %D while price holds a prior support structure. When the crossover forms while both lines are still below 20 — not after they've climbed back out — the signal is strongest. A candle closing above the previous session's high confirms the entry. If price fails to close above that level within 1-2 candles, the setup is invalidated.
The Two Core Stochastic Crossover Setups
Bullish Crossover in Oversold Territory
This is the higher-probability setup. Price has sold off hard, the stochastic drops below 20, and %K then crosses back above %D — signaling exhaustion of selling pressure.
Entry criteria:
- %K drops below 20 and crosses above %D while both lines remain under 20
- Price closes above the most recent swing low candle's high
- Volume is at or above average on the entry candle
- Broader trend is neutral to bullish (confirmed by a rising 50-SMA or flat 200-SMA)
Exit: Target the nearest resistance level or a 1.5–2x ATR extension from entry. Cut the trade if price closes back below the entry candle's low.
Bearish Crossover in Overbought Territory
The mirror setup. %K rises above 80, then crosses back below %D inside that overbought zone. Selling pressure is building and momentum is rolling over.
Entry criteria:
- %K crosses below %D while both lines are above 80
- Price closes below the most recent swing high candle's low
- Broader trend is neutral to bearish or showing distribution patterns
Be more selective with bearish crossovers in bull markets. Overbought conditions can persist for weeks during strong uptrends.
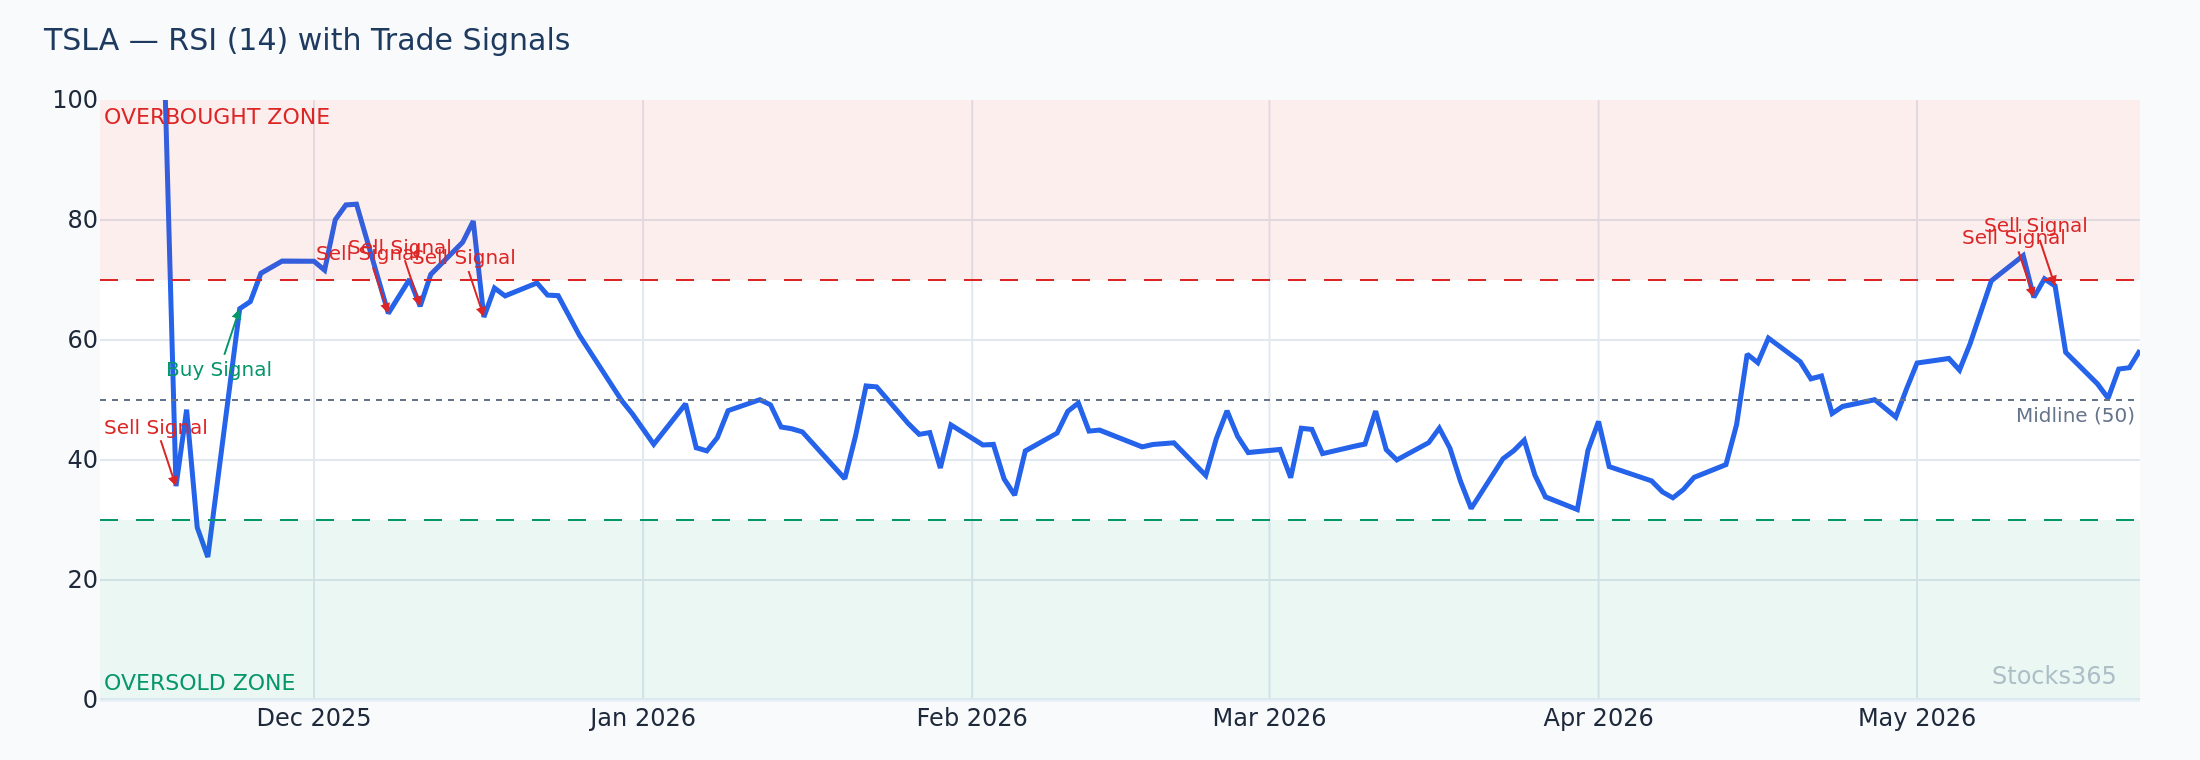
Here the stochastic %K crosses below %D above the 80 level while RSI simultaneously prints a lower high against a higher price high — classic bearish divergence. The combination of these two signals amplifies the short setup significantly. Price typically stalls or reverses within 3-5 candles of this confirmation. The pattern is invalidated if %K crosses back above %D before price breaks the nearest support level.
Here's What Most Traders Get Wrong
Most traders treat any stochastic crossover as a trade signal. They see %K cross %D and immediately enter, regardless of where the lines are sitting. A crossover at the 50 level — the middle of the range — carries almost no predictive value. The edge lives at the extremes. A crossover at 55 is noise. A crossover at 18 is a signal. Filter ruthlessly: only act when the crossover occurs inside the overbought or oversold zones, and ideally when the crossover completes while both lines are still within that zone. Everything else is waiting.
Stochastic Crossover Confirmation: Building a Stronger Signal
A stochastic crossover alone is a weak signal. Stack it with one or two confirming factors and the probability shifts meaningfully in your favor.
Combine With Moving Averages
Use a 20-SMA and 50-SMA as trend filters. Take bullish crossover signals only when price is trading above the 50-SMA. Take bearish crossover signals only when price is below the 50-SMA. This single filter eliminates a large chunk of counter-trend fades that bleed accounts dry.
For a framework on using moving averages alongside momentum indicators, our moving average crossover strategy guide covers the core principles that translate directly to stochastic-based systems.
Combine With Bollinger Bands
When price tags the lower Bollinger Band and the stochastic simultaneously prints a bullish crossover below 20, you're looking at a double-confirmation oversold signal. Our analysis of this combination tells a compelling story.
Stocks365 analyzed 2,501 BB + Stochastic double oversold signals and found a 58.9% win rate with a profit factor of 1.61 over a 10-day holding period — compared to 54.7% for stochastic oversold signals alone. The improvement isn't marginal. Adding Bollinger Band confluence pushes the setup from a slight edge into a genuinely robust one. Best performance came from commodities at 61.1%. For more on pairing these two tools, see our Moving Average + Bollinger Bands strategy guide.
Combine With MACD
When the MACD histogram shifts from negative to positive bars at the same time the stochastic prints a bullish crossover, momentum confirmation is stacking up from two independent calculations. This is especially powerful on the daily timeframe for swing entries. Our MACD in forex trading guide breaks down how MACD confirmation dramatically improves signal quality in currency pairs — the same logic applies across equities and crypto.
Combine With RSI Trendlines
Draw a trendline on the RSI panel connecting recent highs or lows. When RSI breaks that trendline at the same moment the stochastic crossover fires, you have momentum confirmation from a completely different angle. The RSI trendline strategy is underused and pairs naturally with stochastic crossovers for high-conviction entries.
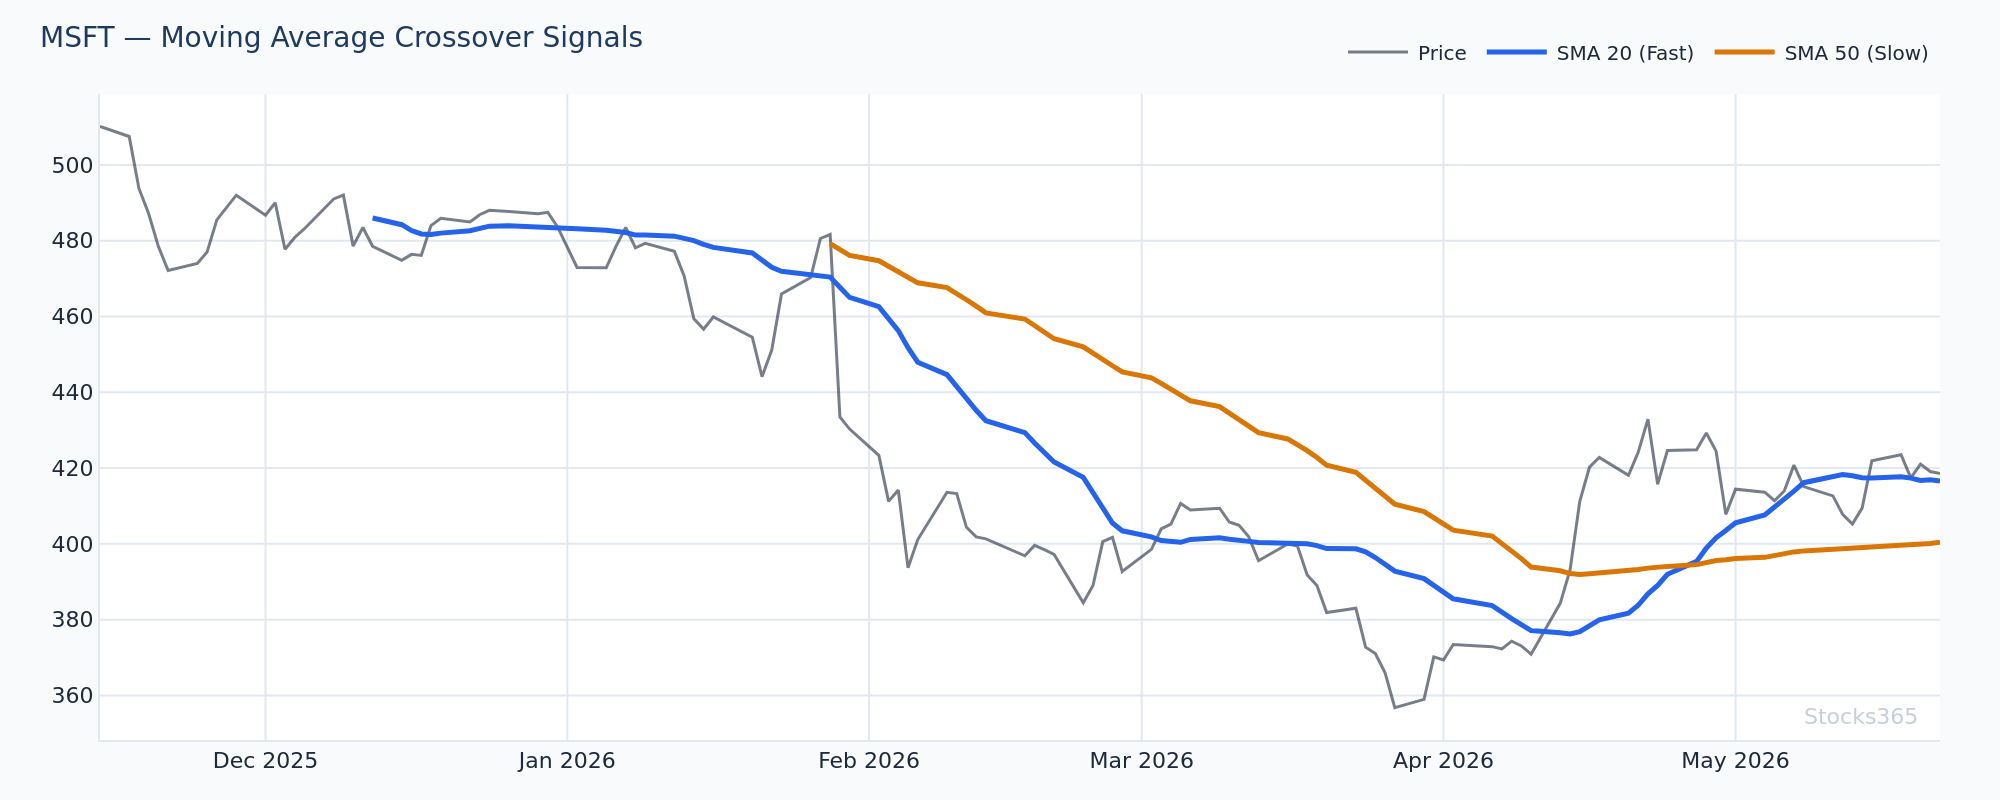
This setup shows the stochastic printing a bullish crossover below 20 just as MSFT price reclaims the 50-SMA from below — two independent confirmation signals firing simultaneously. This is the type of alignment that separates high-quality entries from random noise trades. The setup gains additional strength if volume on the reclaim candle exceeds the 20-day average volume. Failure to hold above the 50-SMA on a closing basis is the clearest invalidation signal.
When the Stochastic Crossover Works — and When It Fails
Best Market Conditions
The stochastic oscillator crossover performs best in ranging and mean-reverting markets. When price oscillates between defined support and resistance levels, the oversold crossover near support and the overbought crossover near resistance become high-probability setups.
Asset class matters significantly. Our research shows stochastic oversold signals in forex produce a 57.0% win rate — the highest of any asset class in the dataset — versus just 48.9% in crypto. Currency pairs tend to exhibit cleaner mean-reversion behavior, particularly in major pairs during ranging phases.
For more on applying the stochastic specifically to forex, our step-by-step guide on how to read the stochastic oscillator walks through chart interpretation from scratch.
When It Fails
Strong trending markets punish stochastic crossover traders who aren't using trend filters. In a persistent uptrend, the stochastic will generate bearish crossovers in overbought territory repeatedly — and price will keep climbing right through them. The indicator is telling you the market is overbought. The market doesn't care.
Crypto is the starkest example. Our data shows stochastic overbought signals in crypto deliver only a 48.8% win rate — effectively a coin flip with negative expectancy (profit factor: 0.86). Crypto trends hard. Shorting overbought crossovers in crypto bull regimes is a losing game. Check our research dashboard for updated breakdowns by asset class and market regime.
High-volatility events kill the signal. Earnings, central bank decisions, macro data drops — avoid holding stochastic crossover positions through these events unless the trade is already well into profit.
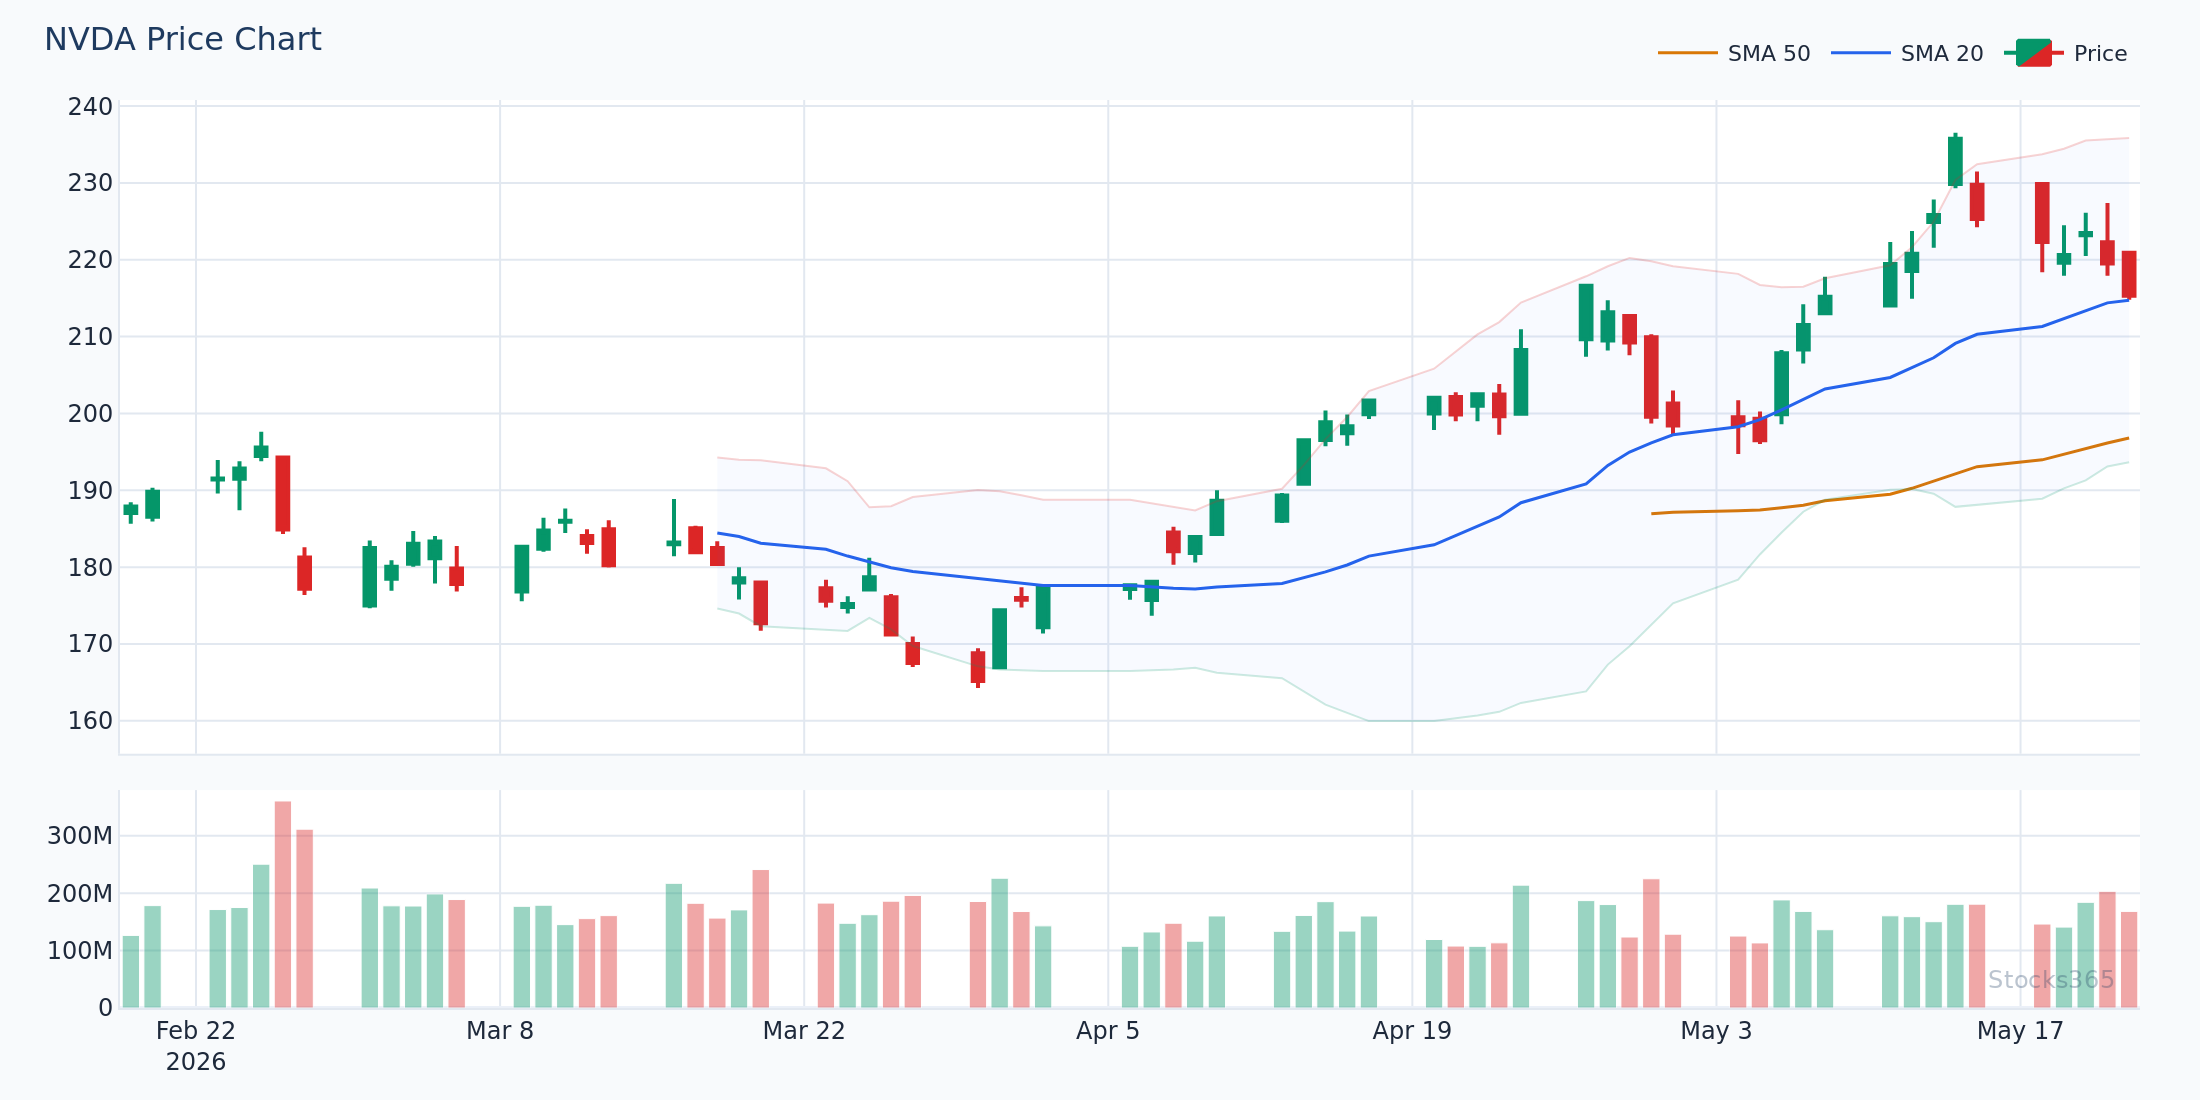
This chart is a lesson in what happens without a trend filter. Multiple bearish stochastic crossovers fire in overbought territory while NVDA continues its uptrend — each one a losing short entry. The 50-SMA is sloping aggressively upward throughout. A simple rule — no bearish crossover trades when price is above a rising 50-SMA — would have kept a trader out of every one of these losing setups. The pattern shows how the same indicator that works well in ranges destroys capital in trends when applied mechanically.
Timeframe Selection for Stochastic Crossover Trades
The timeframe changes everything about how you apply this strategy.
- Daily chart: Best for swing traders. Signals are fewer but cleaner. The 10-day holding period in our backtests is naturally aligned with daily chart swing trading.
- 4-hour chart: Useful for active traders wanting more frequent setups while still filtering intraday noise. Confirm with the daily chart trend direction before entering.
- 15-minute to 1-hour charts: High signal frequency but elevated false signal rate. Require stricter filters and tighter risk management. Best used by experienced traders who already understand the pattern's behavior on higher timeframes.
- Weekly chart: Slow-moving but powerful for position traders and investors. A weekly stochastic bullish crossover below 20 has historically preceded multi-week recovery moves in major indices.
Use the triple moving average strategy for trend confirmation across timeframes to ensure you're entering crossover trades aligned with the dominant trend direction — not fighting it.
Risk Management for Stochastic Crossover Trades
The strategy has a positive edge. Protect it with disciplined risk management or you'll give it back on the inevitable losing runs.
- Stop placement: Place stops beyond the most recent swing low (bullish setup) or swing high (bearish setup). ATR-based stops — typically 1–1.5x ATR below entry on longs — keep stops proportional to market volatility.
- Position sizing: Risk a fixed percentage of capital per trade, not a fixed number of shares or contracts. This keeps drawdowns manageable during losing streaks.
- Reward-to-risk: Target a minimum 1.5:1 reward-to-risk ratio. Given the 54.7% win rate on oversold signals, a 1.5:1 ratio produces a positive expected value over a large sample.
- Scale out: Take partial profits at 1x ATR and let the remaining position run to the full target. This locks in wins while staying in trades that extend.
Consistency compounds. One position sizing rule, applied every trade, outperforms improvised sizing by a wide margin over 100+ trades.
What to Watch For
- Stochastic bullish crossover below 20 on the daily chart, with price simultaneously reclaiming a rising 20-SMA — this is the cleanest entry pattern for swing longs. The SMA reclaim acts as dynamic support confirmation and dramatically reduces the false signal rate compared to a crossover in isolation.
- Double oversold confirmation: lower Bollinger Band tag plus stochastic crossover below 20 — particularly powerful in commodity markets and forex majors during ranging phases. Our backtested data shows this combination produces a profit factor of 1.61, making it one of the higher-confidence setups in the stochastic toolkit.
- Bearish crossover above 80 accompanied by a bearish RSI divergence (price making higher high, RSI making lower high) — this combination on the daily chart in a stock that has already extended 15–25% from its 50-SMA is a high-conviction reversal or pullback setup. See our RSI trendline strategy for how to structure the RSI confirmation.
- Weekly chart stochastic bullish crossover in an index ETF or large-cap stock after a 20%+ drawdown — weekly signals are rare but carry significant weight. When a weekly stochastic crossover aligns with a daily crossover (multi-timeframe confluence), the setup is among the highest-quality entries available with this indicator.
- Stochastic crossover firing while Bollinger Bands are in a squeeze (band width at or below the 20th percentile for the past 6 months) — the combination of a volatility contraction breaking out alongside a momentum crossover signals that the next directional move may be sharp and sustained. For background on the squeeze setup, see our Bollinger Bands case study.
How Stocks365 Uses This
🔬 How Stocks365 Integrates the Stochastic Crossover
The stochastic oscillator crossover is one of 12+ indicators feeding the Stocks365 Trust Score system. It contributes specifically to the momentum agreement layer of the score — the component that measures whether multiple momentum-based signals are aligned in the same direction at the same time.
When the stochastic crossover fires in agreement with MACD direction and RSI positioning, the momentum agreement score rises. When they diverge — for example, a bullish stochastic crossover while MACD remains in a bearish histogram — the Trust Score reflects that conflict and flags the setup as lower conviction.
The regime scoring layer also adjusts stochastic signal weighting based on current market conditions. In trending regimes, overbought crossover shorts are down-weighted. In range-bound regimes, they're given more weight. This dynamic adjustment is what separates systematic signal scoring from static indicator readings.
You can see stochastic-based signals and Trust Scores for individual stocks directly on the Stocks365 signals dashboard, or check specific setups — for example, the AAPL signal page shows current stochastic positioning alongside the full Trust Score breakdown.
Key Takeaways
📌 Stochastic Oscillator Crossover — Key Takeaways
- Only act on crossovers inside the overbought (above 80) or oversold (below 20) zones — mid-range crossovers are noise
- Stochastic oversold signals carry a 54.7% win rate and 1.24 profit factor across 8,204 backtested signals — better than overbought signals (48.8%, profit factor 0.86)
- Adding Bollinger Band confirmation pushes the win rate to 58.9% with a 1.61 profit factor — stack your signals
- Use moving averages as trend filters — only take bullish crossovers above a rising 50-SMA and bearish crossovers below a falling one
- Forex shows the best stochastic oversold performance (57.0% win rate); crypto shows the worst overbought performance (48.9%) — asset class selection matters
- Multi-timeframe confluence (daily + weekly crossover alignment) produces the highest-confidence setups
- The Stocks365 Trust Score weights stochastic crossovers within a momentum agreement layer — strongest signals show alignment across MACD, RSI, and stochastic simultaneously