
Stochastic Oscillator Divergence: The Reversal Signal Most Traders Miss
Price makes a new high. The stochastic oscillator doesn't. That gap — that disagreement between price and momentum — is one of the most powerful reversal signals in technical analysis. And most traders scroll right past it.
Stochastic oscillator divergence happens when price and the %K/%D lines move in opposite directions. It tells you that momentum is fading before price confirms the reversal. That's the edge. You're not reacting to a reversal — you're anticipating it.
This guide breaks down exactly how divergence works, the setups that produce the highest-quality signals, and the mistakes that cause traders to misread them entirely.
Stocks365 Data Point: Our analysis of 8,204 stochastic oversold signals shows a 54.7% win rate over a 10-day holding period (profit factor: 1.24). Forex leads the asset classes at 57.0%. That edge is real — but only when you know which divergence signals to trust. Explore our research dashboard for the full breakdown.
What Is Stochastic Oscillator Divergence?
The stochastic oscillator measures where the current closing price sits relative to the high-low range over a defined lookback period — typically 14 periods. It outputs two lines: %K (the fast line) and %D (the slow, smoothed line). Values range from 0 to 100.
Divergence occurs when price and the oscillator tell different stories.
If you need a refresher on how the indicator is built from the ground up, How the Stochastic Oscillator Works: Formula Explained covers every calculation step in detail. And for a practical reading guide, How to Read the Stochastic Oscillator: Step-by-Step walks through interpretation with real chart examples.
There are two core types of divergence to master:
Bearish Stochastic Divergence
Price prints a higher high. The stochastic oscillator prints a lower high. Momentum is weakening even as price climbs. This is a warning that buying pressure is exhausting itself. Reversals often follow.
Bullish Stochastic Divergence
Price prints a lower low. The stochastic oscillator prints a higher low. Selling pressure is fading. Price may still be declining, but momentum has already bottomed. That divergence between price and momentum is your early signal.
Hidden divergence also exists — where the oscillator makes a lower high while price makes a higher high in an uptrend (bullish continuation) or the reverse in a downtrend. Hidden divergence confirms trend continuation rather than reversal. Both types matter. Know which one you're trading.
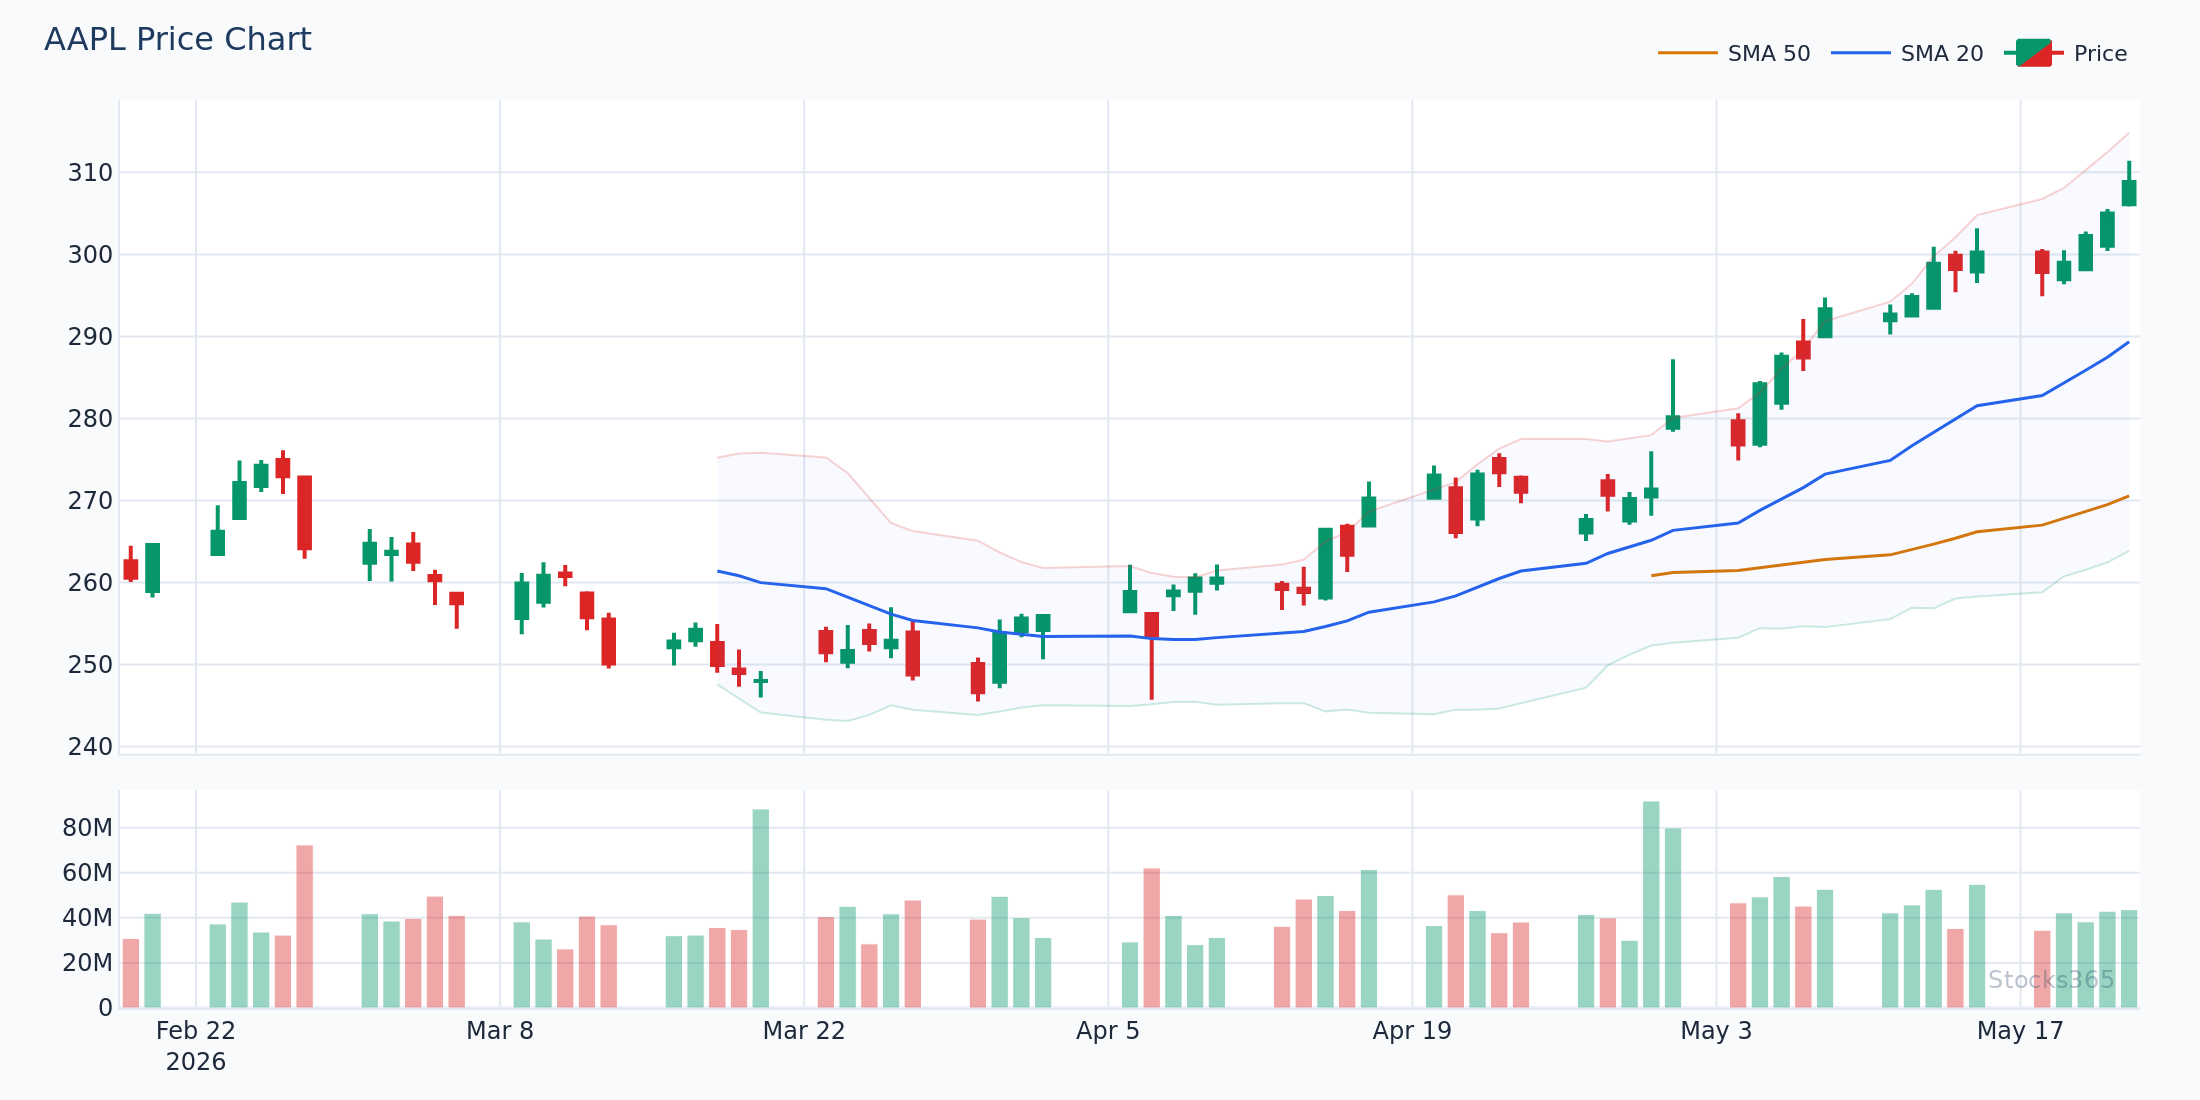
This chart shows price extending into overbought territory while the stochastic %K line forms a visibly lower peak. The divergence here is clean — two swing highs on price, two swing highs on the oscillator, but heading in opposite directions. When %K crosses back below %D following this pattern, it typically confirms the reversal entry. Invalidation comes if price breaks above the second high with the oscillator also pushing to a new peak — that erases the divergence setup entirely.
Why Stochastic Divergence Works: The Momentum Logic
Price is a lagging reflection of market participants' behavior. Momentum is faster. It peaks and troughs ahead of price because the underlying buying or selling activity starts deteriorating before price visibly reverses.
Think about what happens near a market top. Early buyers take profits. New buyers step in, but with less conviction — they push price marginally higher but the range of each candle tightens. Volume thins out. The stochastic, which measures closing price relative to the range, starts printing lower readings even as the absolute price level ticks up. That compression is the divergence.
It's not magic. It's math.
The same logic applies in reverse at market bottoms. Sellers exhaust themselves. Each new low takes more effort and produces less downside follow-through. The stochastic starts rising while price grinds lower. Divergence forms. The reversal follows.
How to Identify High-Quality Divergence Setups
Not all divergence is equal. A stochastic divergence signal that forms in a choppy, ranging market with no structure is nearly worthless. A divergence that forms at a key swing point after an extended trend — that's a different story entirely.
The Setup Checklist
- Clear swing points: Both the price swing and the oscillator swing must be visually obvious — not micro-movements on a noisy chart.
- Extended trend preceding the divergence: A divergence forming after 3–5 strong trend candles carries more weight than one forming mid-range.
- Oscillator in extreme territory: Bearish divergence is strongest when the stochastic was above 80. Bullish divergence is strongest when it was below 20. Divergence in the 40–60 zone is low conviction.
- %K/%D crossover confirmation: Wait for the %K line to cross the %D line in the direction of the anticipated reversal. This is your trigger — not the divergence itself.
- Price structure agreement: Look for price to also break a minor trendline, a swing high/low, or cross a short-term moving average at the same time as the oscillator crossover.
This setup captures the classic bullish divergence structure: price is still descending and making lower lows, but the stochastic is already curling upward and forming a higher trough in oversold territory. The key confirmation trigger here is the %K line crossing above %D while both remain below 30. If that crossover occurs alongside price reclaiming a short-term moving average, the signal quality improves substantially. The setup is invalidated if price closes below the second low and the stochastic drops to a new trough.
Here's What Most Traders Get Wrong
Most traders treat divergence as a standalone buy or sell signal. They see price make a new high, spot a lower high on the stochastic, and immediately enter a short. Then the trend continues for another six candles and they're stopped out.
Divergence is a warning. It is not an entry trigger.
In strong trending markets, stochastic divergence can persist for many candles before the reversal actually materializes. The oscillator keeps printing lower highs while price keeps printing higher highs. If you enter on the first divergence signal in a strong uptrend, you're fighting the momentum before it's truly broken.
The fix is simple: require confirmation before entering. The %K/%D crossover is one confirmation. A break of a price-side trendline or a close below a key moving average is another. Two confirmations happening simultaneously is when the probability shifts meaningfully in your favor. One signal alone isn't enough.
Patience isn't a personality trait here. It's a performance edge.
Combining Stochastic Divergence With Other Indicators
Stochastic divergence works better when it's not operating in isolation. The most effective traders use it as one layer in a multi-indicator confluence system.
Stochastic + MACD Divergence
When stochastic divergence aligns with MACD histogram divergence on the same timeframe, the signal quality jumps significantly. Two momentum indicators disagreeing with price simultaneously is a much stronger case for reversal than either one alone. For MACD-based strategies, especially in currency markets, MACD in Forex Trading: Master Currency Pair Strategies covers the approach in depth.
Stochastic + Bollinger Bands
A particularly effective combination: stochastic divergence forming while price touches or briefly pierces the outer Bollinger Band. Price tagging the upper band while the stochastic shows a lower high is a compressed, high-probability bearish setup. The band acts as dynamic resistance while the oscillator confirms momentum failure. Our backtested data on Moving Average + Bollinger Bands: Complete Strategy Guide explores this kind of confluence in detail.
Stochastic + Trendline Breaks
Drawing trendlines on the stochastic oscillator itself — connecting the swing highs on the %K line — creates an additional confirmation layer. When that oscillator trendline breaks in the direction of the anticipated reversal while price-side divergence is also present, entries become far cleaner. The same technique applies to RSI, as covered in RSI Trendline Strategy: Master Drawing Lines for Better Signals.
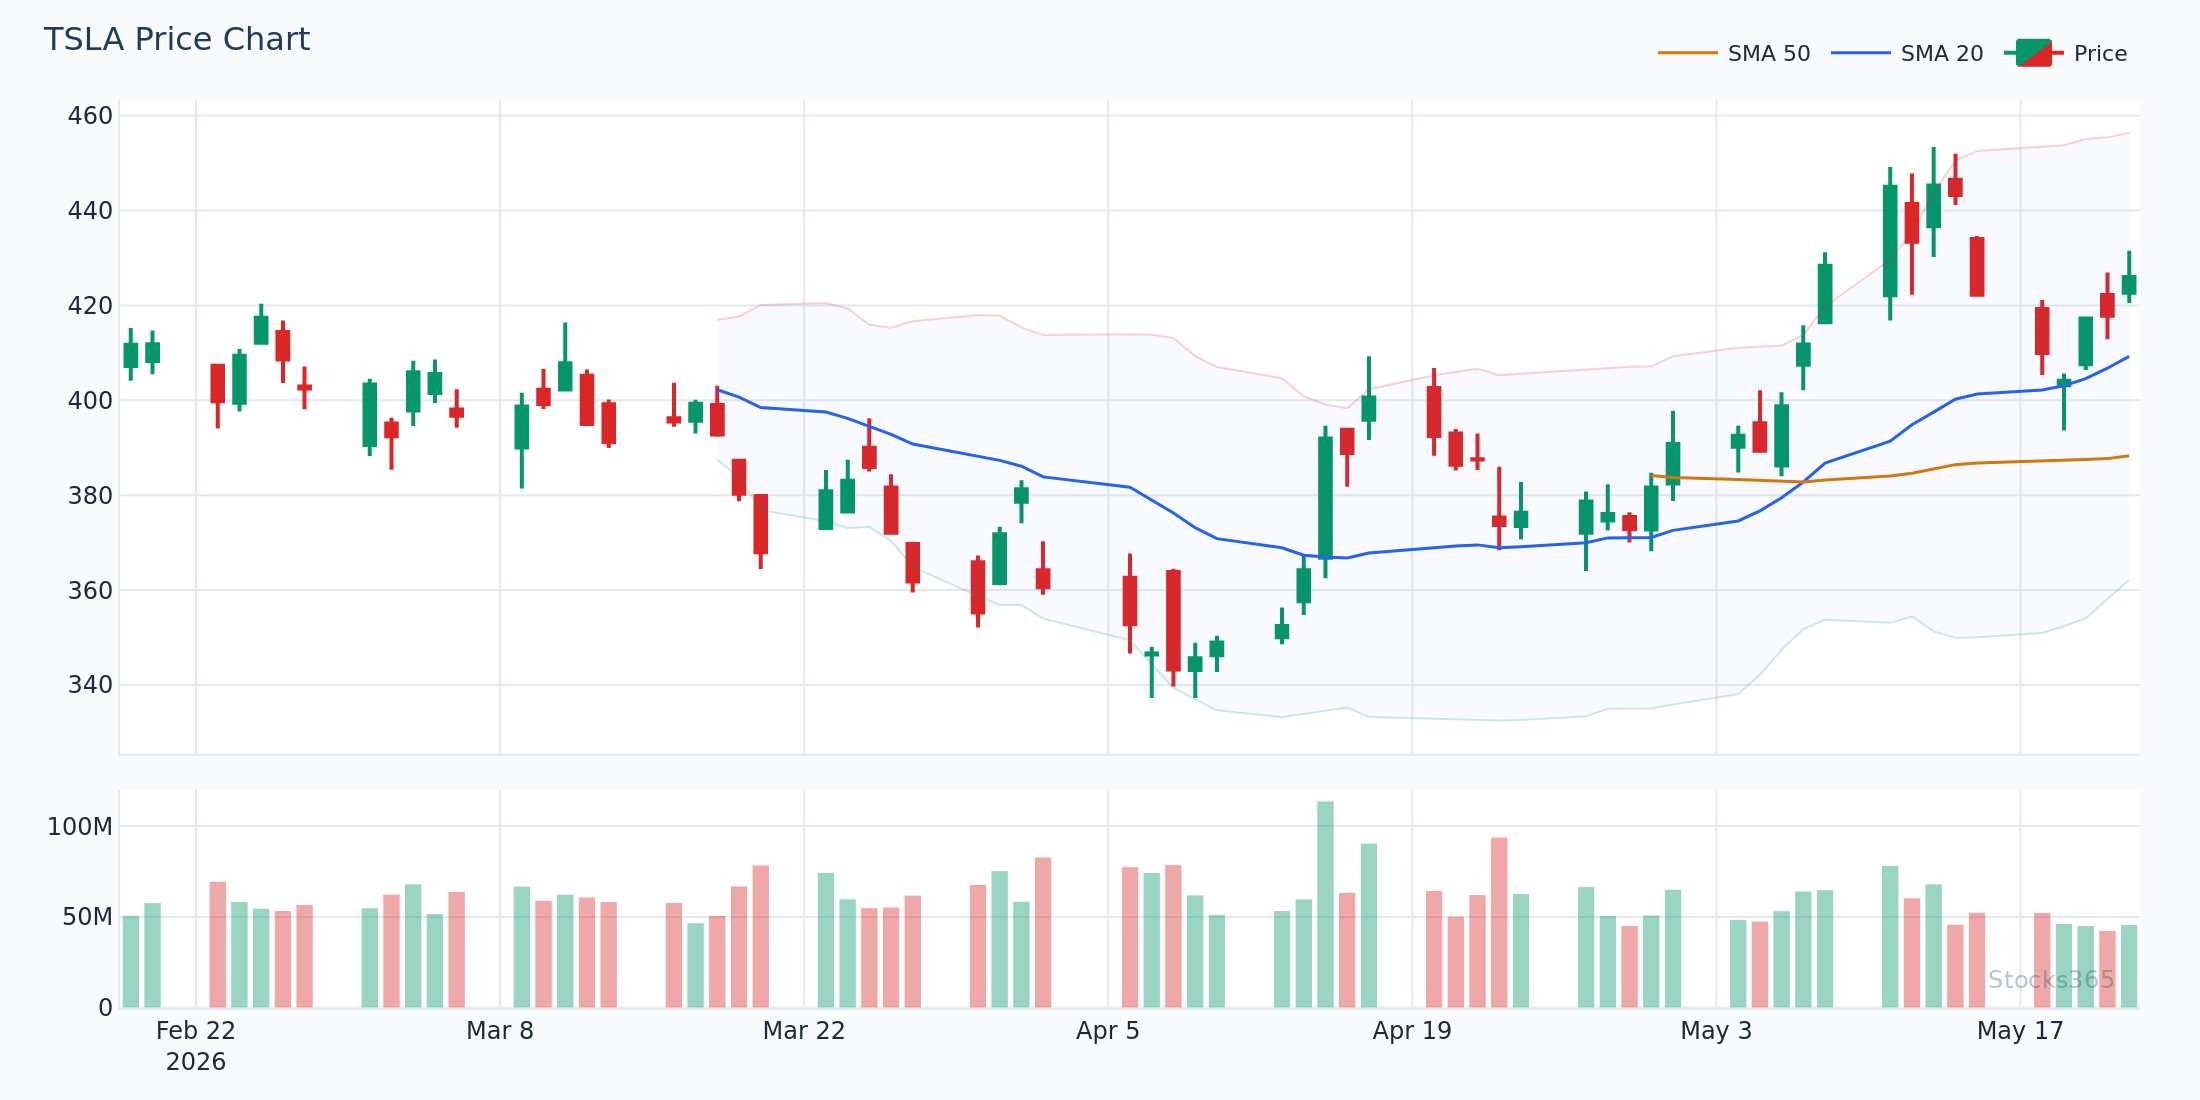
This chart illustrates the dual-confirmation bearish setup: price extends to the upper Bollinger Band while the stochastic %K registers a visibly lower peak compared to the prior swing high. The band contact acts as natural overhead resistance, and the oscillator confirms that momentum is already retreating from that level. Confirmation triggers include %K crossing below %D and price closing back inside the Bollinger Band after the tag. The pattern is invalidated if price closes above the upper band with expanding band width — that signals a breakout rather than a reversal.
Divergence Across Timeframes: Where It Works Best
Timeframe selection changes everything with stochastic divergence.
On shorter timeframes (5-minute, 15-minute), divergence signals are frequent but noisy. Many of them fail because market microstructure noise generates false swings. On daily and weekly charts, divergence signals are rarer but carry significantly more weight — they reflect multi-session conviction shifts, not intraday fluctuations.
The professional approach: identify divergence on a higher timeframe (daily), then drop to a lower timeframe (1-hour or 4-hour) to find a precision entry trigger. The higher timeframe sets the directional bias. The lower timeframe gives you the entry timing.
This multi-timeframe layering pairs naturally with trend confirmation tools. Triple Moving Average Strategy for Trend Confirmation gives you a framework for defining the higher-timeframe trend bias before hunting divergence entries on smaller timeframes.
Asset Class Performance: Where Divergence Has the Most Edge
Stocks365 Backtested Data: Across our analysis of stochastic oversold signals (n=8,204), the win rate varied substantially by asset class. Forex delivered the strongest results at 57.0%. Crypto significantly underperformed at 48.9% — barely above a coin flip. This matters when you're deciding which markets to apply divergence strategies in. Not all assets respond equally to momentum exhaustion signals.
Forex markets tend to respond well to stochastic divergence because currency pairs often trend cleanly, then exhaust at key levels. When divergence forms at a major resistance or support zone, the reversion tendency is historically reliable.
Crypto is more problematic. The asset class is prone to momentum-driven parabolic moves where divergence signals form early and fail repeatedly before the actual reversal. In crypto, stochastic divergence works better as a position-sizing signal (reduce exposure when divergence appears) rather than a hard entry/exit trigger.
For stocks specifically, Moving Average Crossover Strategy: Complete Trading Guide and Bollinger Bands Case Study: Apple Stock 2022–2023 Decoded both show how momentum-based signals perform in equity markets when combined with structural price analysis.
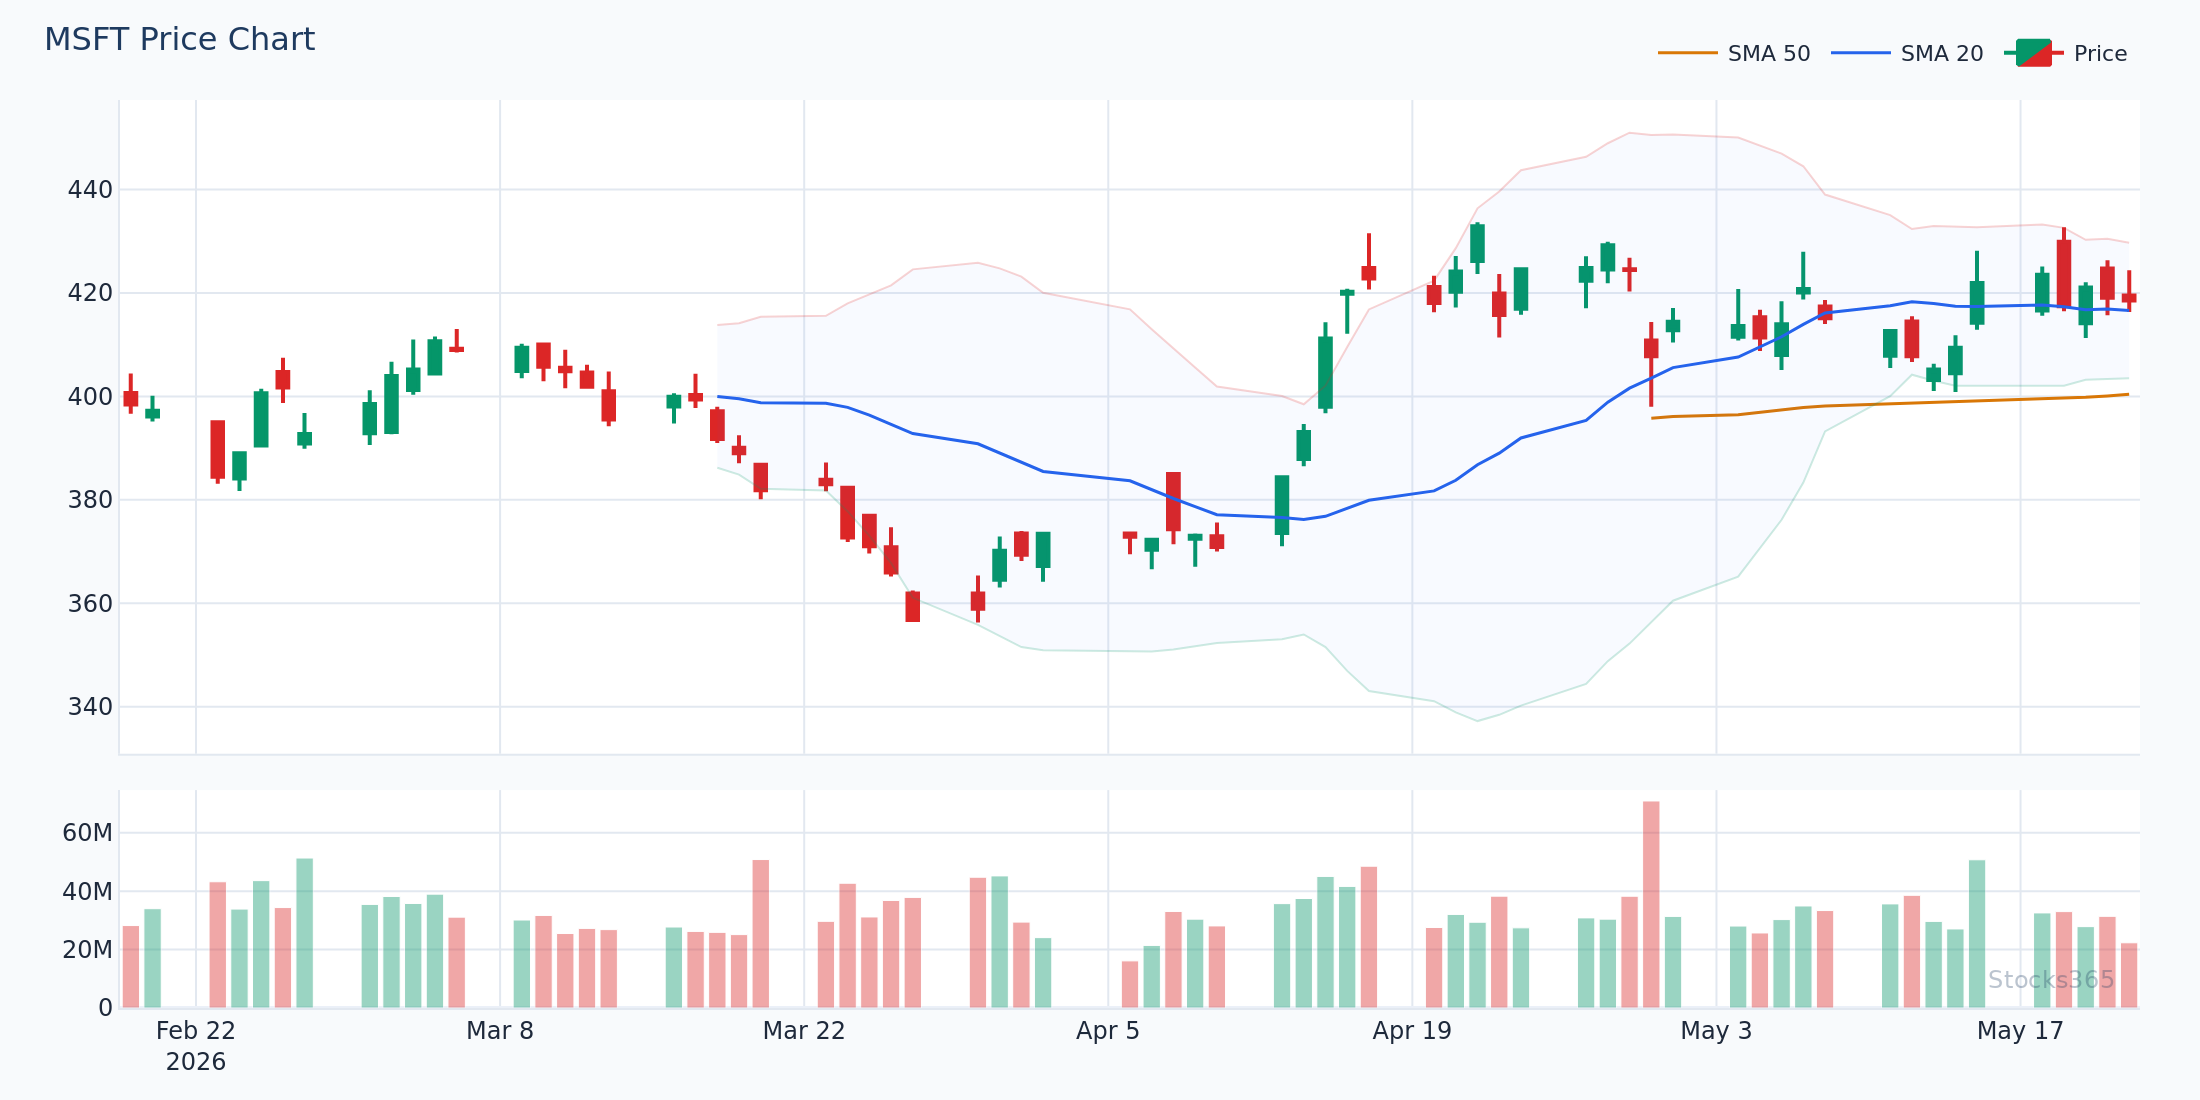
This chart demonstrates the multi-timeframe approach: the daily chart shows bearish stochastic divergence forming after an extended rally, while the 4-hour view provides the actual entry trigger — a %K/%D crossover alongside price breaking below a short-term rising trendline. The alignment between the timeframes is what elevates the signal from speculative to high-conviction. If the daily divergence forms but the 4-hour oscillator is still trending upward without a crossover, the setup isn't ready — wait for both timeframes to agree.
What to Watch For
- Stochastic bearish divergence after 5+ trend candles in the same direction: When an extended one-directional move is followed by a price high with a lower stochastic peak, and the %K line crosses below %D in overbought territory, the reversal probability increases meaningfully — especially on daily timeframes in forex majors.
- Bullish divergence where stochastic was sub-20 on two consecutive lows: When the oscillator reaches deeply oversold territory twice while price makes lower lows, but the second stochastic low is higher than the first, that double-dip divergence in extreme territory is one of the cleanest reversal setups available.
- Divergence coinciding with the price testing a 50-period or 200-period moving average: When the stochastic prints divergence exactly as price touches a major dynamic support or resistance level, the two signals together — momentum exhaustion plus structural level — create high-probability confluence entries.
- Hidden divergence in a confirmed trend after a pullback: In a clear uptrend, when price pulls back but holds above the prior swing low, and the stochastic makes a lower low while price holds higher, that hidden bullish divergence is a trend-continuation entry — not a reversal. These setups often produce sharp resumes of the primary trend.
- Divergence on a lower timeframe while the higher timeframe stochastic is turning from an extreme: Multi-timeframe alignment — where both the daily and 4-hour stochastic agree — produces significantly fewer false signals than single-timeframe divergence alone.
How Stocks365 Uses This
How Stocks365 Integrates Stochastic Divergence Into Its Trust Score System
Stochastic oscillator divergence is one of 12+ indicators that feed into the Stocks365 Trust Score — our proprietary signal confidence rating that appears on every alert across the signals dashboard.
Specifically, stochastic readings contribute to two scoring components: the momentum agreement layer (which evaluates whether multiple momentum indicators are aligned) and the regime scoring layer (which assesses whether the asset is in a trending or mean-reverting environment — divergence signals carry more weight in trending regimes).
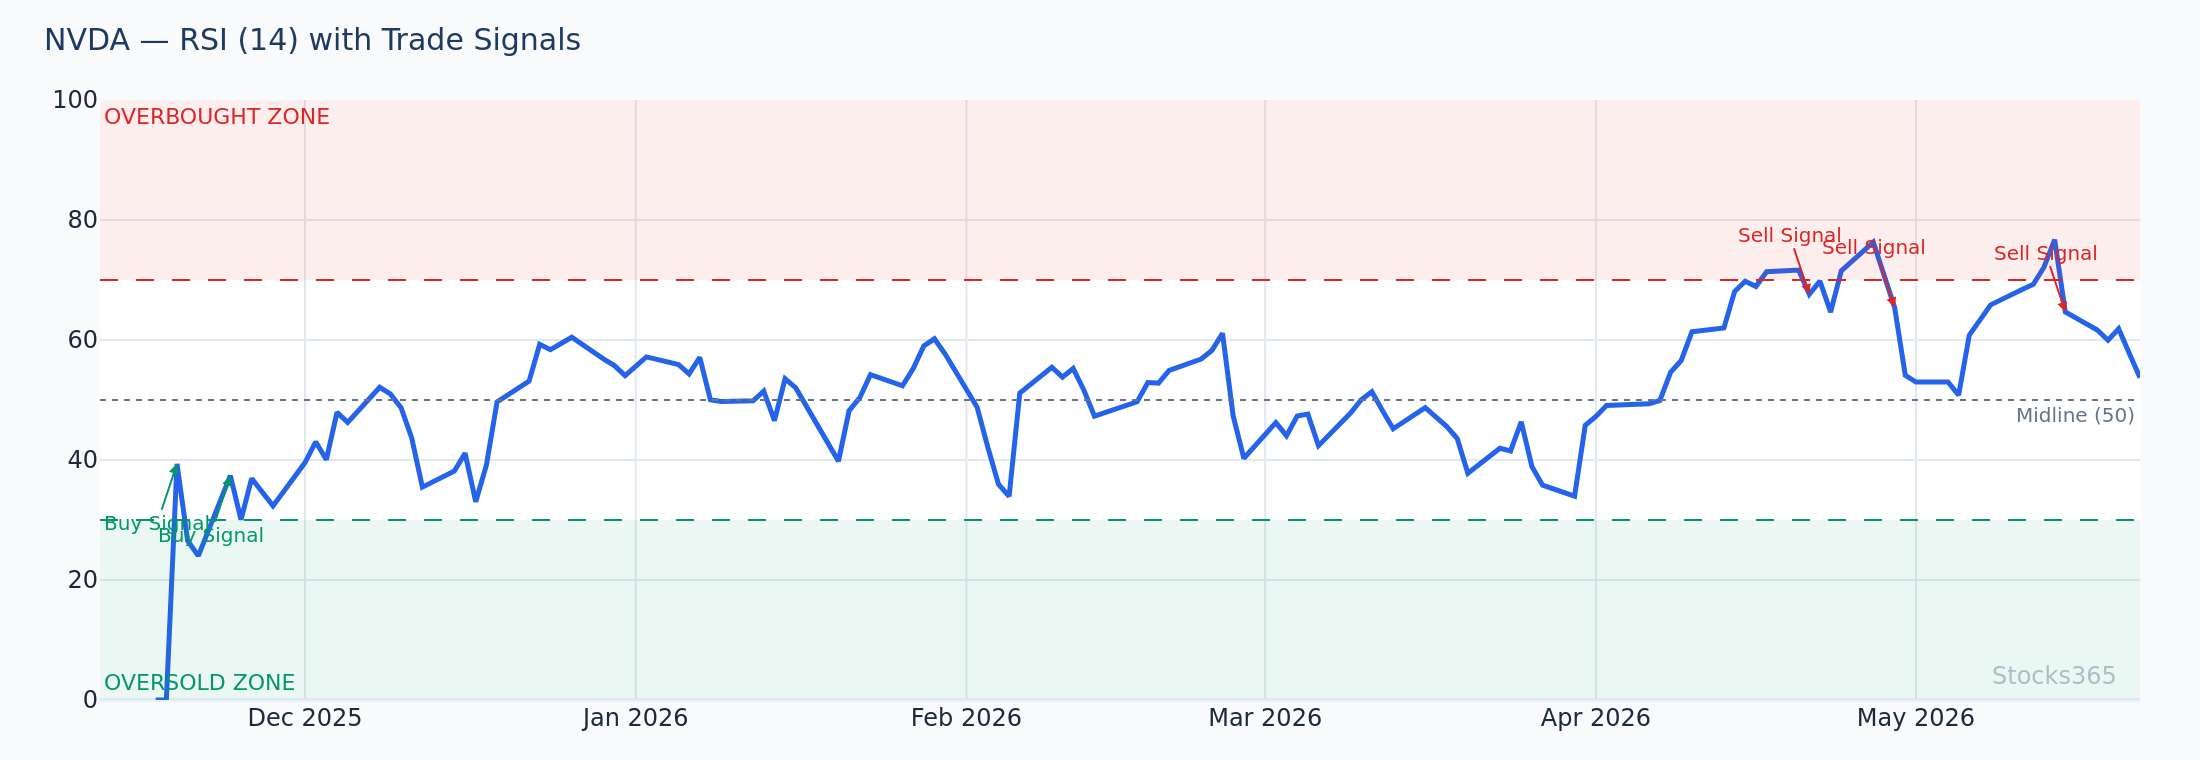
When a signal like AAPL fires on the platform, the Trust Score reflects whether the stochastic divergence is confirmed by other momentum indicators (like MACD) and whether it's appearing in the statistically stronger conditions our backtesting has identified. A stochastic oversold signal in isolation scores differently than the same signal combined with Bollinger Band compression and multi-timeframe confluence. The system weights each layer accordingly — so you always know how much conviction stands behind every alert.
Key Takeaways
- Stochastic oscillator divergence forms when price and the oscillator move in opposite directions — a signal that momentum is shifting before price confirms it.
- Bearish divergence (price higher high, oscillator lower high) warns of potential topping. Bullish divergence (price lower low, oscillator higher low) warns of potential bottoming.
- Divergence alone is not an entry signal. Require confirmation: a %K/%D crossover, a price-side trendline break, or a moving average cross before committing.
- Asset class matters. Stochastic oversold divergence performs best in forex (57.0% win rate) and worst in crypto (48.9%) based on Stocks365 backtested data across 8,204 signals.
- Multi-indicator confluence — combining stochastic divergence with MACD, Bollinger Bands, or trendline breaks — meaningfully improves signal quality and reduces false positives.
- Higher timeframes produce cleaner signals. Daily and weekly divergence setups carry more conviction than intraday noise. Use lower timeframes only for entry precision after the higher-timeframe bias is established.
- The Stocks365 signals dashboard incorporates stochastic divergence into its Trust Score system — so every alert reflects multi-layer momentum confirmation, not single-indicator noise.