
Stochastic Oscillator vs MACD: Which Momentum Tool Actually Delivers?
Two indicators. Both measure momentum. Both appear on millions of charts every single day. But the stochastic oscillator vs MACD debate isn't just academic — choosing the wrong tool for the wrong market condition costs real money.
Stocks365 backtested 2,310 MACD Bullish Cross signals and found a 49.7% win rate over a 10-day holding period. That number alone tells a story — and it's not the one most retail traders expect. We'll break it down fully below.
This article gives you a direct, honest comparison. No fluff. No vague advice about "combining indicators." Just the mechanics, the edge cases, and the setups that actually matter.
Understanding the Core Difference: Speed vs. Trend
Before comparing signals, understand what each indicator was built to do.
What the Stochastic Oscillator Measures
The stochastic oscillator compares a closing price to its price range over a set lookback period — typically 14 periods. The result is a value between 0 and 100. Readings above 80 signal overbought conditions. Readings below 20 signal oversold. The %K line is fast. The %D line is a smoothed signal line.
The stochastic reacts quickly. It's designed for range-bound markets where price oscillates between support and resistance. When price is chopping sideways, the stochastic gives you high-frequency, actionable signals. For a deep dive into the formula and mechanics, read How the Stochastic Oscillator Works: Formula Explained.
What MACD Measures
MACD — Moving Average Convergence Divergence — tracks the relationship between two exponential moving averages, typically 12-period and 26-period EMAs. The MACD line is the difference between them. The signal line is a 9-period EMA of the MACD line. The histogram visualizes the gap between the two.
MACD is slower. It's a trend-following tool that excels when markets are directional. Crossovers, histogram reversals, and divergence patterns are its primary signals. For currency-specific applications, MACD in Forex Trading: Master Currency Pair Strategies covers how it performs across major pairs.
Here's the core truth: stochastic is a mean-reversion tool. MACD is a trend-continuation tool. Using them interchangeably is the fastest way to generate losing trades.
This chart highlights the key divergence in signal quality. In the ranging phase, stochastic crossovers align tightly with price reversals — each bounce and fade follows an overbought or oversold reading. When price begins trending, MACD crossovers fire later but stay valid far longer. A stochastic overbought reading during a strong uptrend gets invalidated immediately as price keeps pushing — confirming that context determines which tool leads.
Stochastic Oscillator: When It Works and When It Fails
The Setup That Produces Reliable Signals
The stochastic oscillator performs best in three specific conditions: defined price channels, post-spike consolidation, and low-volatility sideways markets. Look for %K crossing above %D from below 20 — that's the cleanest entry signal in a range environment. When both lines exit the oversold zone together, it confirms buying pressure is building.
The classic confirmation pattern: stochastic %K crosses above %D while price holds above the lower Bollinger Band or a key moving average. Volume confirmation adds confidence. This setup generates its highest probability when price hasn't broken structure — it's bouncing between established levels.
For a step-by-step visual walkthrough, How to Read the Stochastic Oscillator: Step-by-Step breaks down each signal type clearly.
Where Stochastic Gets Traders Killed
Here's what most traders get wrong: they treat stochastic overbought readings as automatic sell signals. In a strong trending market, stochastic can stay above 80 for 10, 20, even 30 consecutive candles. Shorting every overbought reading during a momentum rally is a death-by-a-thousand-cuts strategy. The edge isn't the overbought reading — it's watching %K break back below 80 after a sustained overbought run, especially when price simultaneously fails at resistance.
Our analysis of 9,257 stochastic overbought signals found a win rate of just 48.8% with a profit factor of 0.86 over a 10-day holding period. The worst performance came in commodities (44.6% win rate). Commodities trend hard. Fading momentum in trending commodity markets is a consistent losing strategy — the data confirms it. Explore the full breakdown on our research dashboard.
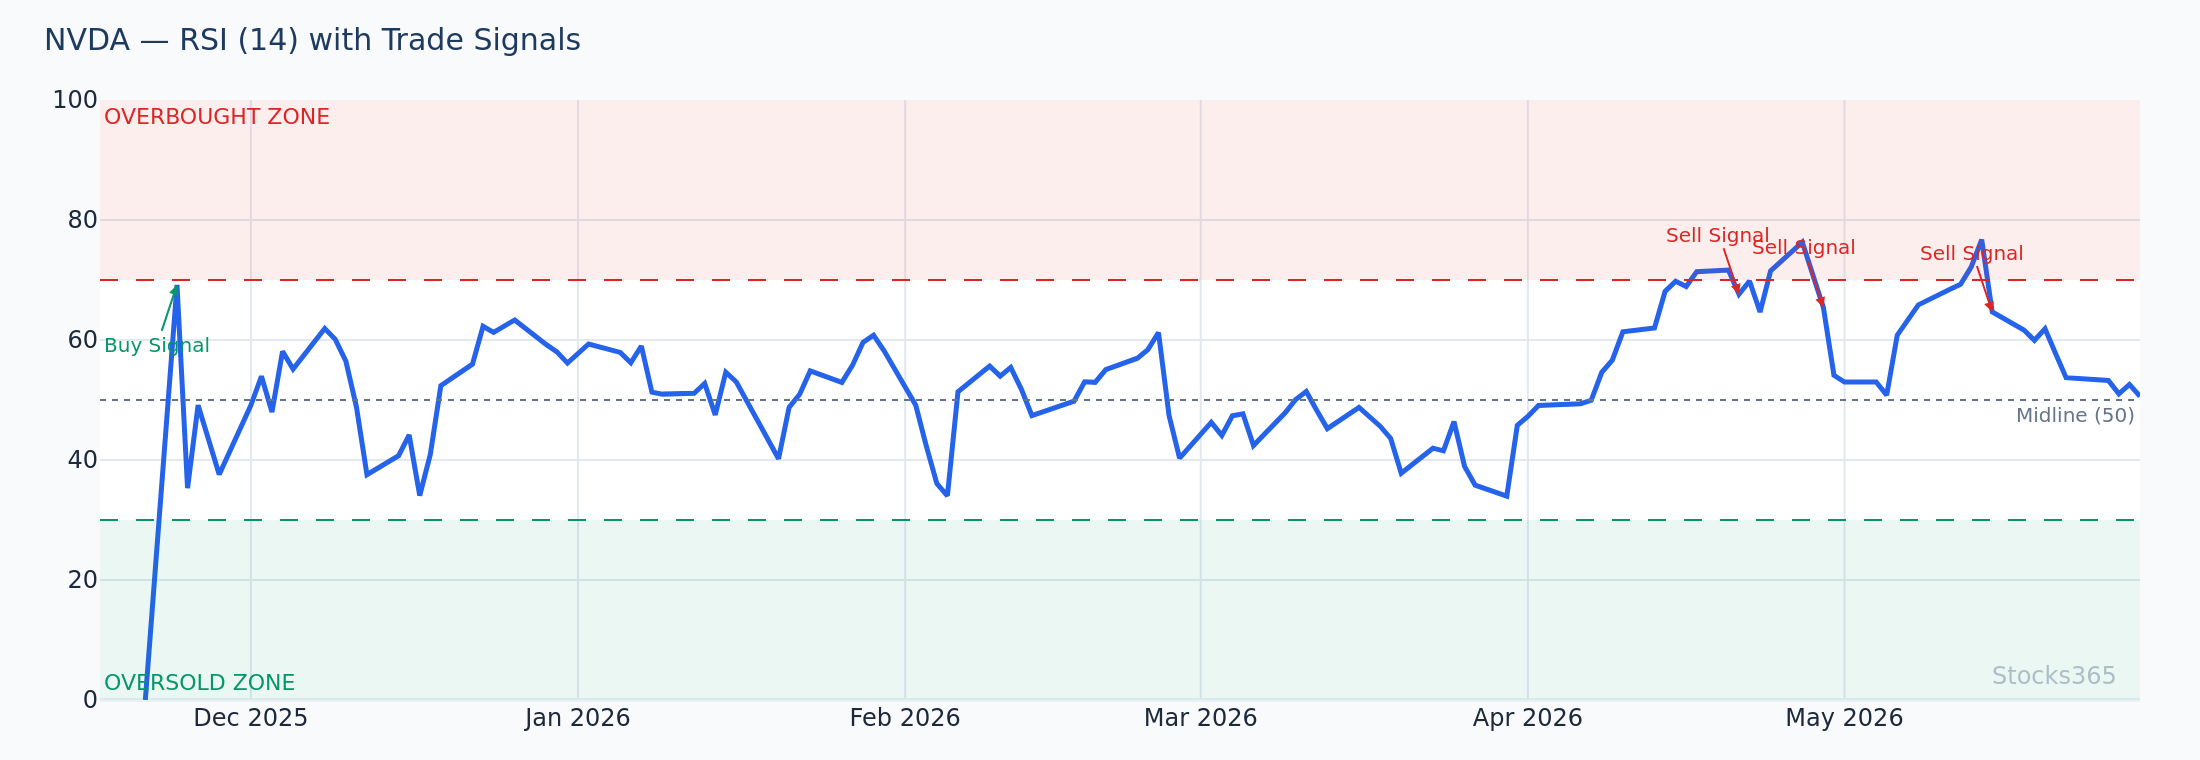
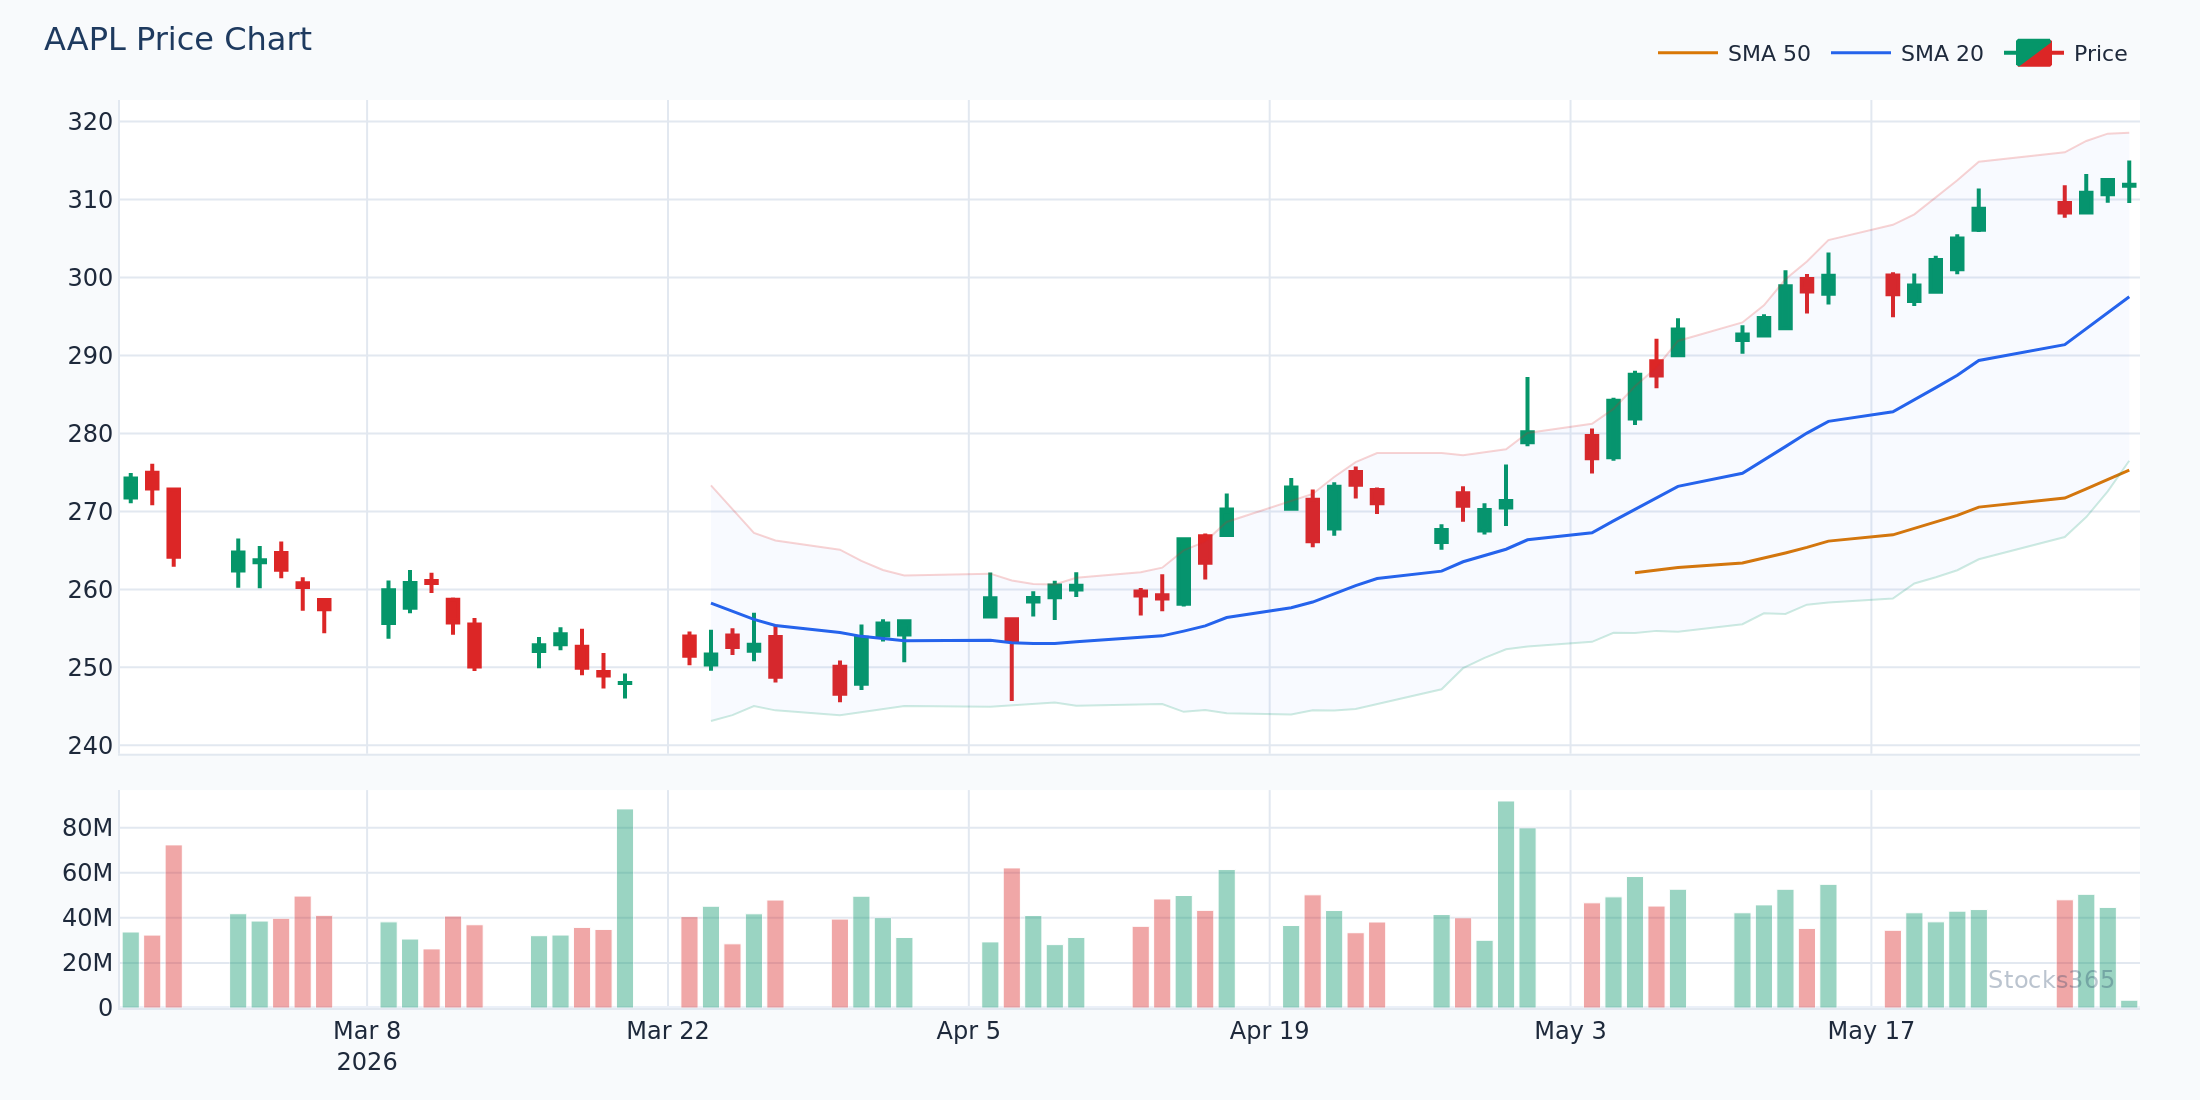
This chart shows stochastic pinned above 80 as price continues its steady climb — each false sell signal marked clearly. The pattern illustrates why context is everything: momentum stocks in sustained uptrends render overbought signals meaningless in isolation. What confirms a genuine reversal here is stochastic breaking back below 80 and price closing beneath the 20-period EMA on elevated volume. Without both conditions, the signal is noise.
MACD: When It Works and When It Fails
The Setups That Carry Real Edge
MACD shines in three scenarios: emerging trends after consolidation, strong momentum with expanding histograms, and divergence setups where price makes new highs but MACD doesn't follow.
The histogram reversal is particularly powerful. When the histogram is negative but the bars start shrinking — each bar smaller than the last — selling pressure is exhausting. A cross back above zero with increasing histogram bars confirms trend resumption. This setup pairs beautifully with moving average analysis; see Moving Average Crossover Strategy: Complete Trading Guide for complementary confirmation techniques.
MACD divergence is where experienced traders extract real edge. Price makes a lower low but MACD makes a higher low — that's bullish divergence. The setup suggests momentum is shifting before price confirms it. Add a trend line break on the price chart and the signal becomes significantly higher probability.
Where MACD Loses Its Edge
Stocks365 backtested 2,310 MACD Bullish Cross signals across multiple asset classes and found the overall win rate sits at 49.7% — with a profit factor of just 0.94. In crypto, it drops to 39.2%. This matters. MACD crossovers in highly volatile, whipsaw-prone markets generate frequent false signals because the lagging EMAs can't keep pace with rapid price reversals.
In choppy, low-momentum environments, MACD crossovers fire constantly without follow-through. The 12/26 EMA gap opens, signals a cross — then price reverses and crosses again in the opposite direction within days. This is where stochastic outperforms. Matching the tool to market regime isn't optional. It's the entire game.
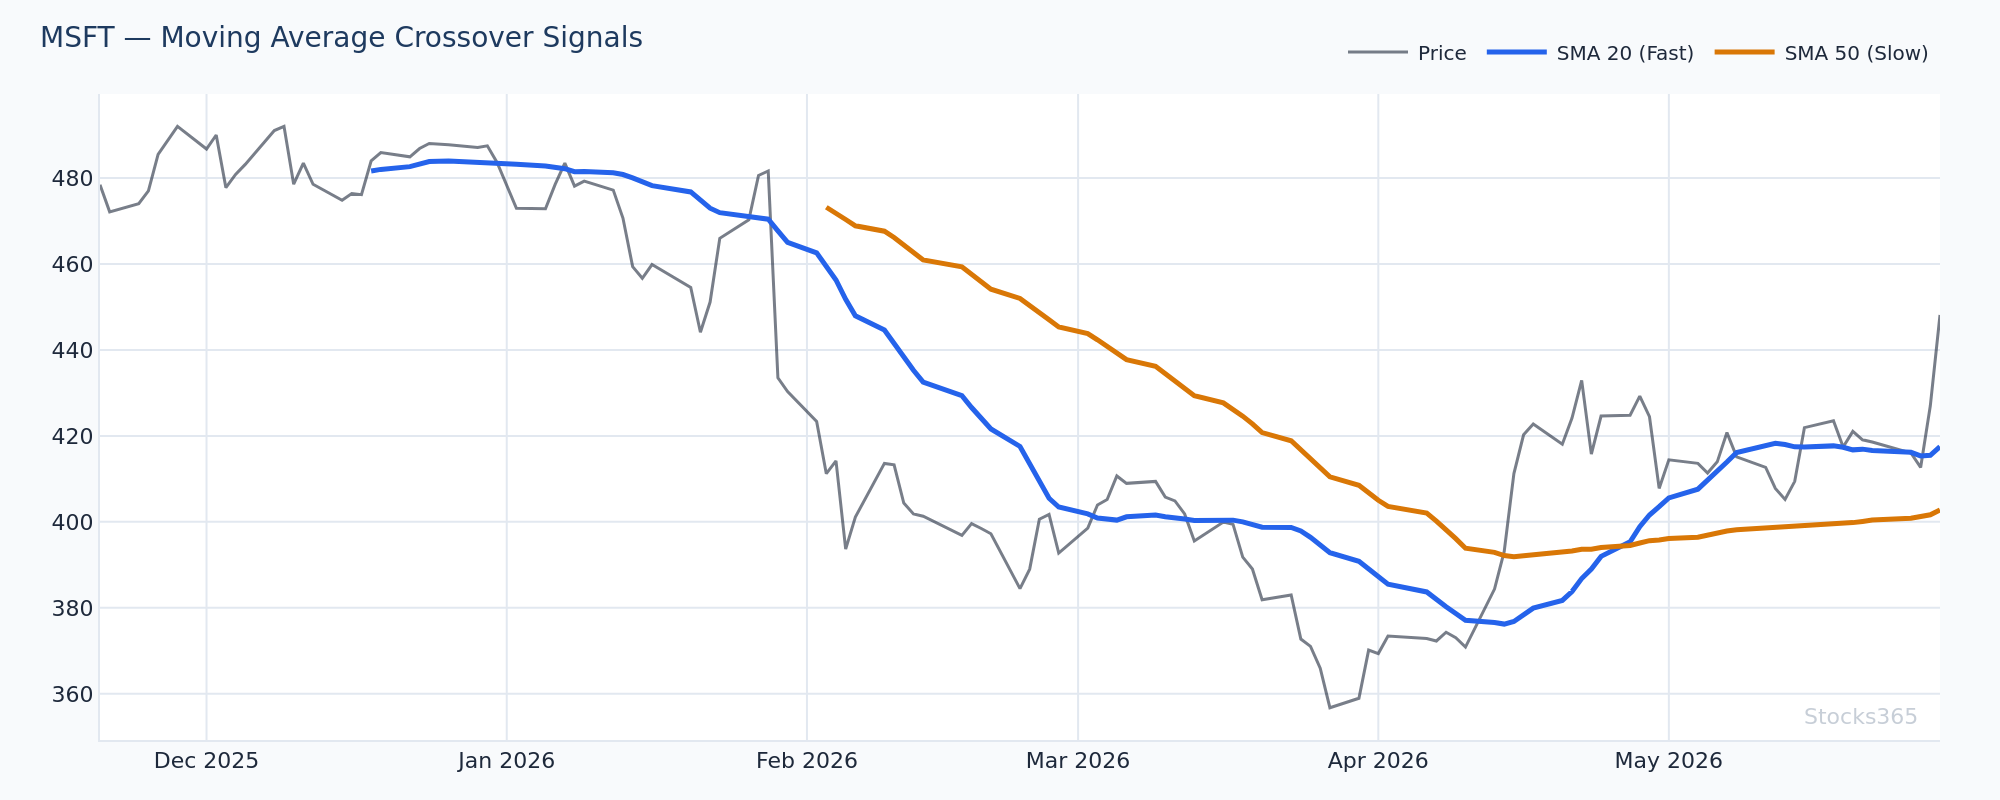
This MSFT chart shows MACD crossover signals filtered through a 50-period SMA trend confirmation. Crossovers that occur while price is above the 50-SMA carry significantly better follow-through — failed signals cluster on the left side of the chart where price was below the trend filter. This visual confirms the critical rule: MACD crossover signals need directional context to generate positive expectancy.
Stochastic Oscillator vs MACD: Direct Comparison Table
- Best Market Condition: Stochastic → Ranging/sideways markets | MACD → Trending/directional markets
- Signal Speed: Stochastic → Fast, frequent | MACD → Slower, less frequent
- Primary Signal Type: Stochastic → Overbought/oversold crossovers | MACD → Line crossovers, histogram reversals, divergence
- False Signal Risk: Stochastic → High in trending markets | MACD → High in choppy/ranging markets
- Best Asset Classes: Stochastic → Equities in range, forex pairs | MACD → Commodities (55.2% win rate on bullish cross), trending indices
- Lagging vs. Leading: Stochastic → More reactive | MACD → More lagging, trend-confirmatory
- Divergence Signals: Both generate divergence signals — MACD divergence tends to be more reliable on longer timeframes
Combining Both Indicators: The Confluence Approach
Why Confluence Works Better Than Choosing One
The real edge isn't picking a winner between stochastic and MACD. It's deploying both together and only trading when they agree.
The confluence setup: stochastic crosses out of oversold territory (below 20) at the same time MACD histogram bars start expanding from below zero. Both conditions firing simultaneously significantly narrows the field — false signals from either indicator alone get filtered out.
Add a trend filter. When price is above the 50-period SMA, take only bullish stochastic/MACD confluences. Below the 50 SMA, take only bearish ones. This three-condition setup reduces signal frequency dramatically but improves the quality of each trade. For multi-indicator frameworks, Triple Moving Average Strategy for Trend Confirmation offers a directly applicable structure.
Timeframe Layering for Stronger Signals
Check MACD on the higher timeframe first. If the weekly MACD is in a bullish phase, drop to the daily chart and use stochastic to time entries into the trend. This top-down approach aligns the short-term mean-reversion tool with the longer-term momentum direction.
When weekly MACD is bullish and daily stochastic drops into oversold, that's the setup. Price is pulling back within a larger uptrend. The stochastic oversold reading marks a short-term entry point with the macro momentum behind it. This is where the two tools become genuinely complementary rather than redundant.
Regime matters. Always.
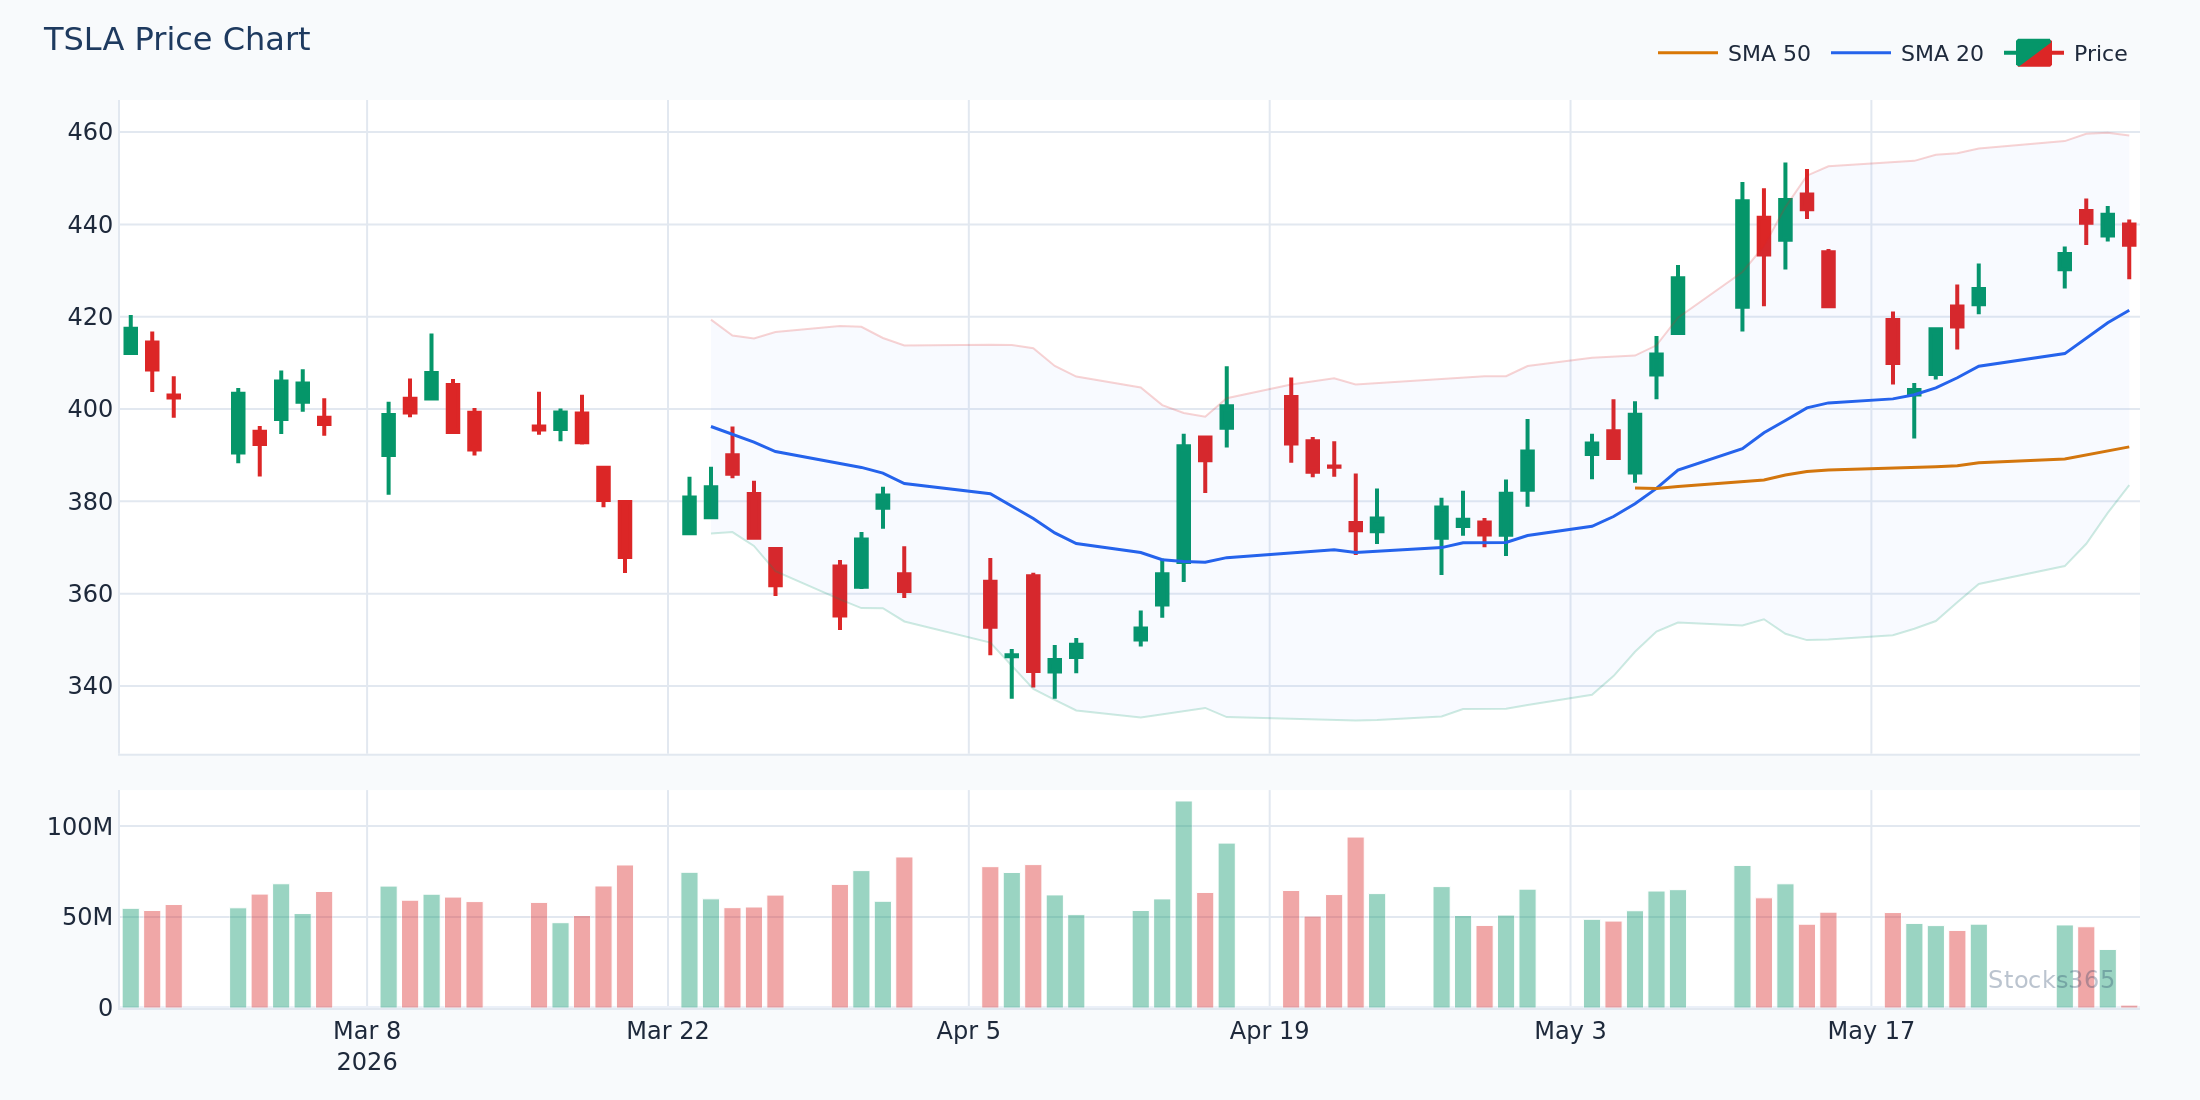
This daily TSLA chart highlights a high-quality confluence setup: MACD histogram transitioning from red to green while stochastic simultaneously crosses above 20 from an oversold reading. Price is holding above the 50-period SMA throughout. When all three conditions align — macro MACD direction, stochastic timing signal, and price above trend filter — the pattern historically produces the cleanest follow-through. The setup invalidates if price closes below the 50-SMA before the stochastic cross completes.
RSI as a Third Confirmation Layer
Both stochastic and MACD can be further filtered by RSI without creating indicator overload — provided you're using RSI for divergence rather than level-based signals. When RSI, stochastic, and MACD all diverge from price simultaneously, that's a high-conviction reversal setup. For RSI-specific techniques, RSI Trendline Strategy: Master Drawing Lines for Better Signals explains how to add structural analysis to oscillator readings.
Three indicators agreeing doesn't guarantee a win. It narrows the probability distribution in your favor. That's all trading edge ever is.
Asset Class Considerations: Where Each Tool Performs
The data is clear on asset class fit. MACD Bullish Cross achieves its highest win rate in commodities at 55.2% — commodity markets tend to trend strongly and with more sustained directional moves, which suits MACD's lag structure. In crypto, MACD Bullish Cross drops to 39.2% because crypto's extreme volatility and rapid reversals generate excessive whipsaws in the lagging EMA system.
For crypto specifically, volatility-aware tools like Bollinger Bands add important context — Moving Average + Bollinger Bands: Complete Strategy Guide outlines a framework that handles volatile asset behavior more robustly. For a real-world case study of volatility-based analysis, Bollinger Bands Case Study: Apple Stock 2022–2023 Decoded is worth reviewing.
For stochastic, equity markets with clear range structure — mid-cap stocks consolidating after earnings, major forex pairs in low-volatility compression — produce the cleanest signals. Commodities and crypto trending environments are where stochastic overbought/oversold readings fail most consistently.
What to Watch For
- MACD histogram shrinkage after an extended trend: When histogram bars grow progressively smaller over 5+ periods in a directional move, momentum is fading. Watch for the first red bar after green expansion — combined with a stochastic rollover from overbought, this often precedes meaningful pullbacks.
- Stochastic oversold confluence with price holding above a key SMA: When stochastic drops below 20 but price hasn't broken below its 50-period SMA, the oversold reading is likely a pullback entry rather than a trend reversal. High-probability setup in stocks showing relative strength.
- Dual divergence on higher timeframes: When both MACD and stochastic diverge from price on the weekly or daily chart simultaneously — price makes new highs while both oscillators post lower highs — the reversal signal carries significantly more weight than either alone.
- MACD zero-line rejection in trending regimes: In strong uptrends, MACD pulling back to the zero line and then bouncing higher (without crossing below) is a continuation pattern. Combine with stochastic exiting oversold on the same bar for an entry with trend alignment.
- Stochastic %K/%D spread compression before a squeeze: When %K and %D converge tightly just above or below the 50 midline after a volatile period, a directional break is often imminent. Use MACD direction to determine which side to trade the breakout.
How Stocks365 Uses This
The Stocks365 Trust Score integrates both stochastic and MACD signals as part of its 12+ indicator agreement system. When momentum indicators across multiple timeframes align — stochastic confirming oversold with MACD showing histogram expansion — the Trust Score reflects that multi-indicator convergence in its regime and agreement scoring layers. A high Trust Score doesn't mean any single indicator is firing; it means the preponderance of momentum, trend, and volatility indicators are pointing in the same direction simultaneously. This systematic approach filters the individual weaknesses of both tools and surfaces only the setups where the broader technical picture supports the trade. Track live signals with Trust Score ratings directly on the Signals Dashboard, or check momentum alignment on individual names like AAPL signals.
| # | Strategy | Type | Win Rate | Sharpe | PF | N | Status |
|---|---|---|---|---|---|---|---|
| #1 | Volume Spike Bullish | momentum | 52.0% | 0.63 | 1.50 | 662 | TEST |
| #2 | MACD Histogram Reversal Up | momentum | 52.0% | 0.14 | 1.09 | 10,666 | TEST |
| #3 | RSI Momentum Shift Down | momentum | 51.3% | 0.02 | 1.01 | 3,085 | TEST |
| #4 | MACD Histogram Reversal Down | momentum | 50.9% | -0.05 | 0.97 | 10,807 | TEST |
| #5 | MACD Bullish Cross | momentum | 49.7% | -0.10 | 0.94 | 2,310 | TEST |
Key Takeaways
- Stochastic oscillator vs MACD isn't a competition — they're complementary tools built for different market conditions.
- Stochastic works best in ranging, sideways markets. Treat overbought/oversold readings as context-dependent, not absolute signals.
- MACD excels in trending environments. Histogram expansion and zero-line dynamics matter more than simple crossovers.
- Backtested data matters: MACD Bullish Cross shows 55.2% win rate in commodities but falls to 39.2% in crypto — asset class fit is non-negotiable.
- Confluence beats isolation. When both tools agree, signal quality improves significantly over using either alone.
- Timeframe alignment is critical. Use MACD for directional bias on higher timeframes, stochastic for timing entries on lower timeframes.
- The Stocks365 Trust Score captures multi-indicator agreement systematically — so you're not manually aligning signals on every chart.