
Stochastic Oscillator vs RSI: Which Momentum Indicator Actually Works?
Two indicators. One debate that never ends. Traders have argued about the stochastic oscillator vs RSI for decades, and most articles give you the same wishy-washy answer: "use both." That's not helpful. This article tells you exactly when each indicator works, when each fails, and how to make a real decision about which one belongs in your trading setup.
The short answer? Neither is universally better. But in specific market conditions and asset classes, one consistently outperforms the other — and the data proves it.
Our analysis of 8,204 stochastic oversold signals found a 54.7% win rate with a profit factor of 1.24 over a 10-day holding period — with forex leading the pack at 57.0%. That's a meaningful edge. Here's why it matters, and when RSI pulls ahead instead.
What Is the RSI? A Quick Refresher
The Relative Strength Index (RSI) measures the speed and magnitude of recent price changes. Developed by J. Welles Wilder in 1978, it oscillates between 0 and 100. Readings above 70 traditionally signal overbought conditions. Below 30 signals oversold.
RSI uses a smoothed average of gains vs. losses over a lookback period — typically 14 periods. The formula compares upward momentum to total momentum. Simple. Powerful. Widely misused.
For a deeper dive into drawing trendlines directly on RSI to improve signal quality, see our guide on the RSI Trendline Strategy.
What Is the Stochastic Oscillator? A Quick Refresher
The stochastic oscillator, developed by George Lane in the 1950s, measures where the current closing price sits relative to the high-low range over a set period. It outputs two lines: %K (the fast line) and %D (the slow, smoothed signal line).
Readings above 80 indicate overbought territory. Below 20 indicates oversold. The crossover of %K above %D in oversold territory is one of the most watched entry signals in technical analysis.
To understand the full formula and mechanics behind the indicator, read our dedicated breakdown: How the Stochastic Oscillator Works: Formula Explained.
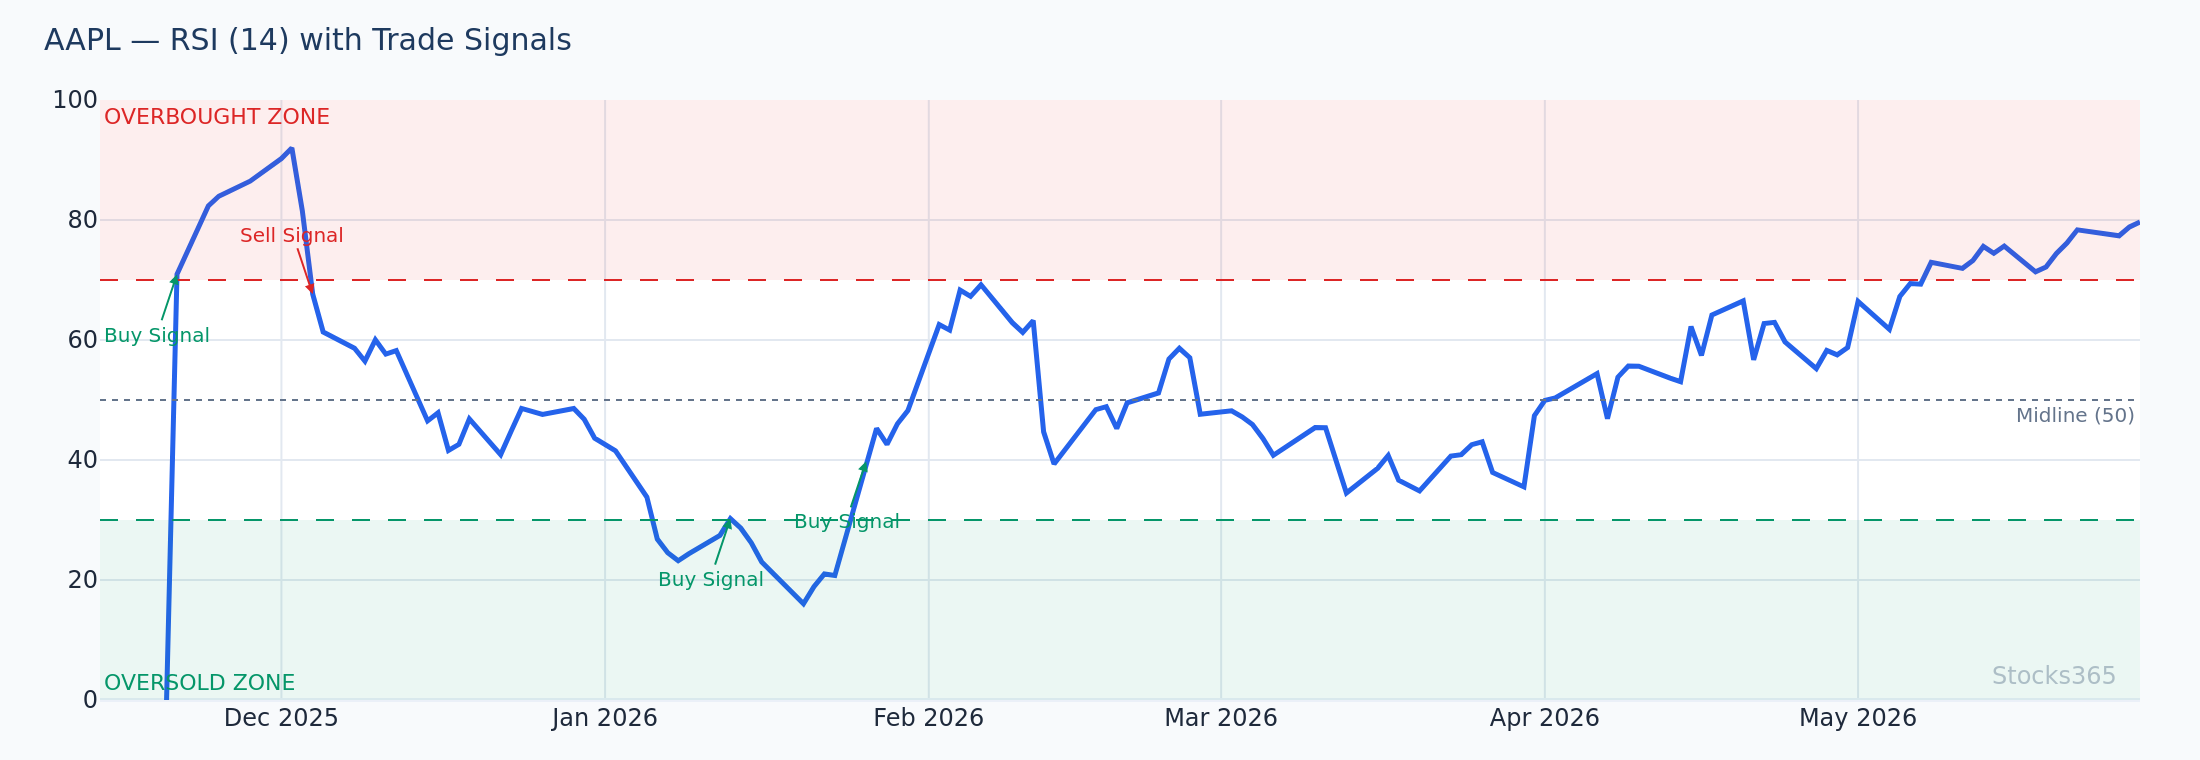
This chart shows how RSI and the stochastic oscillator respond differently to the same price action. Notice that stochastic %K crosses the 20 level earlier and more frequently than RSI drops below 30 — giving more signals, but not always more accurate ones. When both indicators align simultaneously in oversold territory, the probability of a bounce increases meaningfully. A close back above the swing low without either indicator recovering is the key warning sign that the move has failed.
The Core Difference: What Each Indicator Is Actually Measuring
This is where most explanations fall apart. People say "they both measure momentum" and move on. That's incomplete.
RSI measures momentum relative to itself. It asks: how strong has upward movement been compared to downward movement over the last N periods? It's a velocity reading. It tells you how fast price is moving, not necessarily where it sits within a recent range.
Stochastic measures position within a range. It asks: where does the current close sit relative to the recent high-low range? It's a location reading. It's inherently mean-reverting in its logic — price tends to close near the high in uptrends and near the low in downtrends.
That difference is everything. RSI catches trend momentum. Stochastic catches range exhaustion. Once you understand that, you stop treating them as interchangeable and start using them for what they're actually good at.
Stochastic Oscillator vs RSI: Head-to-Head Comparison
Signal Frequency
Stochastic generates more signals. More crossovers, more overbought/oversold readings, more noise. This makes it useful for shorter-term traders who need frequent entry points — but it also means more false signals in trending markets.
RSI is slower to trigger. Fewer signals, but generally cleaner in trending conditions. In a strong uptrend, RSI stays elevated without generating false sell signals as aggressively as stochastic does.
Trending vs. Ranging Markets
RSI wins in trending markets. When a stock is in a sustained uptrend, stochastic repeatedly flashes overbought and triggers premature exits. RSI holds up better — it can stay above 70 for extended periods without giving false reversal signals.
Stochastic wins in ranging markets. When price oscillates between support and resistance, stochastic's range-based logic is perfectly suited. It identifies when price has stretched to the edge of the range and is likely to snap back.
Sensitivity
Stochastic reacts faster to price changes. RSI is smoother. For scalpers and day traders, stochastic's sensitivity is an advantage. For swing traders and position traders, RSI's smoother output reduces whipsaw.
This setup shows price compressing into a lower range while stochastic %K dips below 20 and then crosses back above %D — a classic oversold reversal signal. In a ranging environment like this, the pattern has historically preceded short-term bounces back toward the range midpoint. The signal is invalidated if price breaks to a fresh low while stochastic fails to recover above the 20 threshold within the next two to three candles.
The Backtested Reality: What the Data Actually Shows
Here's where the debate stops being theoretical.
Stocks365 backtested 9,257 stochastic overbought signals across multiple asset classes and found a 48.8% win rate with a profit factor of 0.86 over a 10-day holding period. Crypto was the strongest performer at 58.9%, while commodities lagged at 44.6%. That overall sub-50% win rate tells you something critical: fading overbought stochastic readings indiscriminately is a losing strategy. Asset class matters enormously.
On the RSI side, our analysis of 3,042 RSI Momentum Shift Up signals showed a 48.9% win rate with a profit factor of 0.92 — where stocks performed best at 51.9% and crypto worst at 39.2%. You can explore the full methodology at our research dashboard.
The clearest edge in our data? Stochastic oversold signals — 54.7% win rate across 8,204 signals with a profit factor of 1.24, with forex leading at 57.0%. Buying oversold stochastic readings in forex markets has produced a statistically meaningful edge. That's the signal worth building a process around.
Here's What Most Traders Get Wrong
Most traders treat RSI 70 as an automatic sell signal and RSI 30 as an automatic buy. In a strong trending market, this destroys your account. RSI can sit above 70 for weeks during a momentum run, and every early short gets squeezed out before the actual reversal arrives.
The same mistake happens with stochastic. Traders see %K cross above 80 and immediately assume a top is in. In a powerful uptrend, stochastic can oscillate above 80 repeatedly without a meaningful pullback. The edge isn't in the overbought reading itself — it's in watching for the %K line to break back below 80 after a confirmed failure to make a new high. That's the actual reversal signal. The overbought reading alone is just noise.
Stop trading the level. Trade the behavior around the level.
When to Use RSI Over Stochastic
Trending Markets and Momentum Setups
Use RSI when you're trading with the trend. If a stock has broken above its 20-period moving average with volume expansion, RSI pullbacks to the 40-50 zone (the "RSI support zone" in uptrends) are cleaner re-entry signals than stochastic crossovers.
Divergence Trading
RSI divergence is more reliable than stochastic divergence. When price makes a higher high but RSI makes a lower high, that bearish divergence carries weight — especially on higher timeframes. Stochastic divergence exists but generates too many false readings at shorter timeframes to be trusted in isolation.
Large-Cap Stocks
Our data shows RSI momentum shift signals perform best in stocks (51.9% win rate). If you're trading large-cap equities, RSI fits better. You can also cross-reference with the AAPL signal page to see how current RSI readings stack against the Stocks365 trust score in real time.
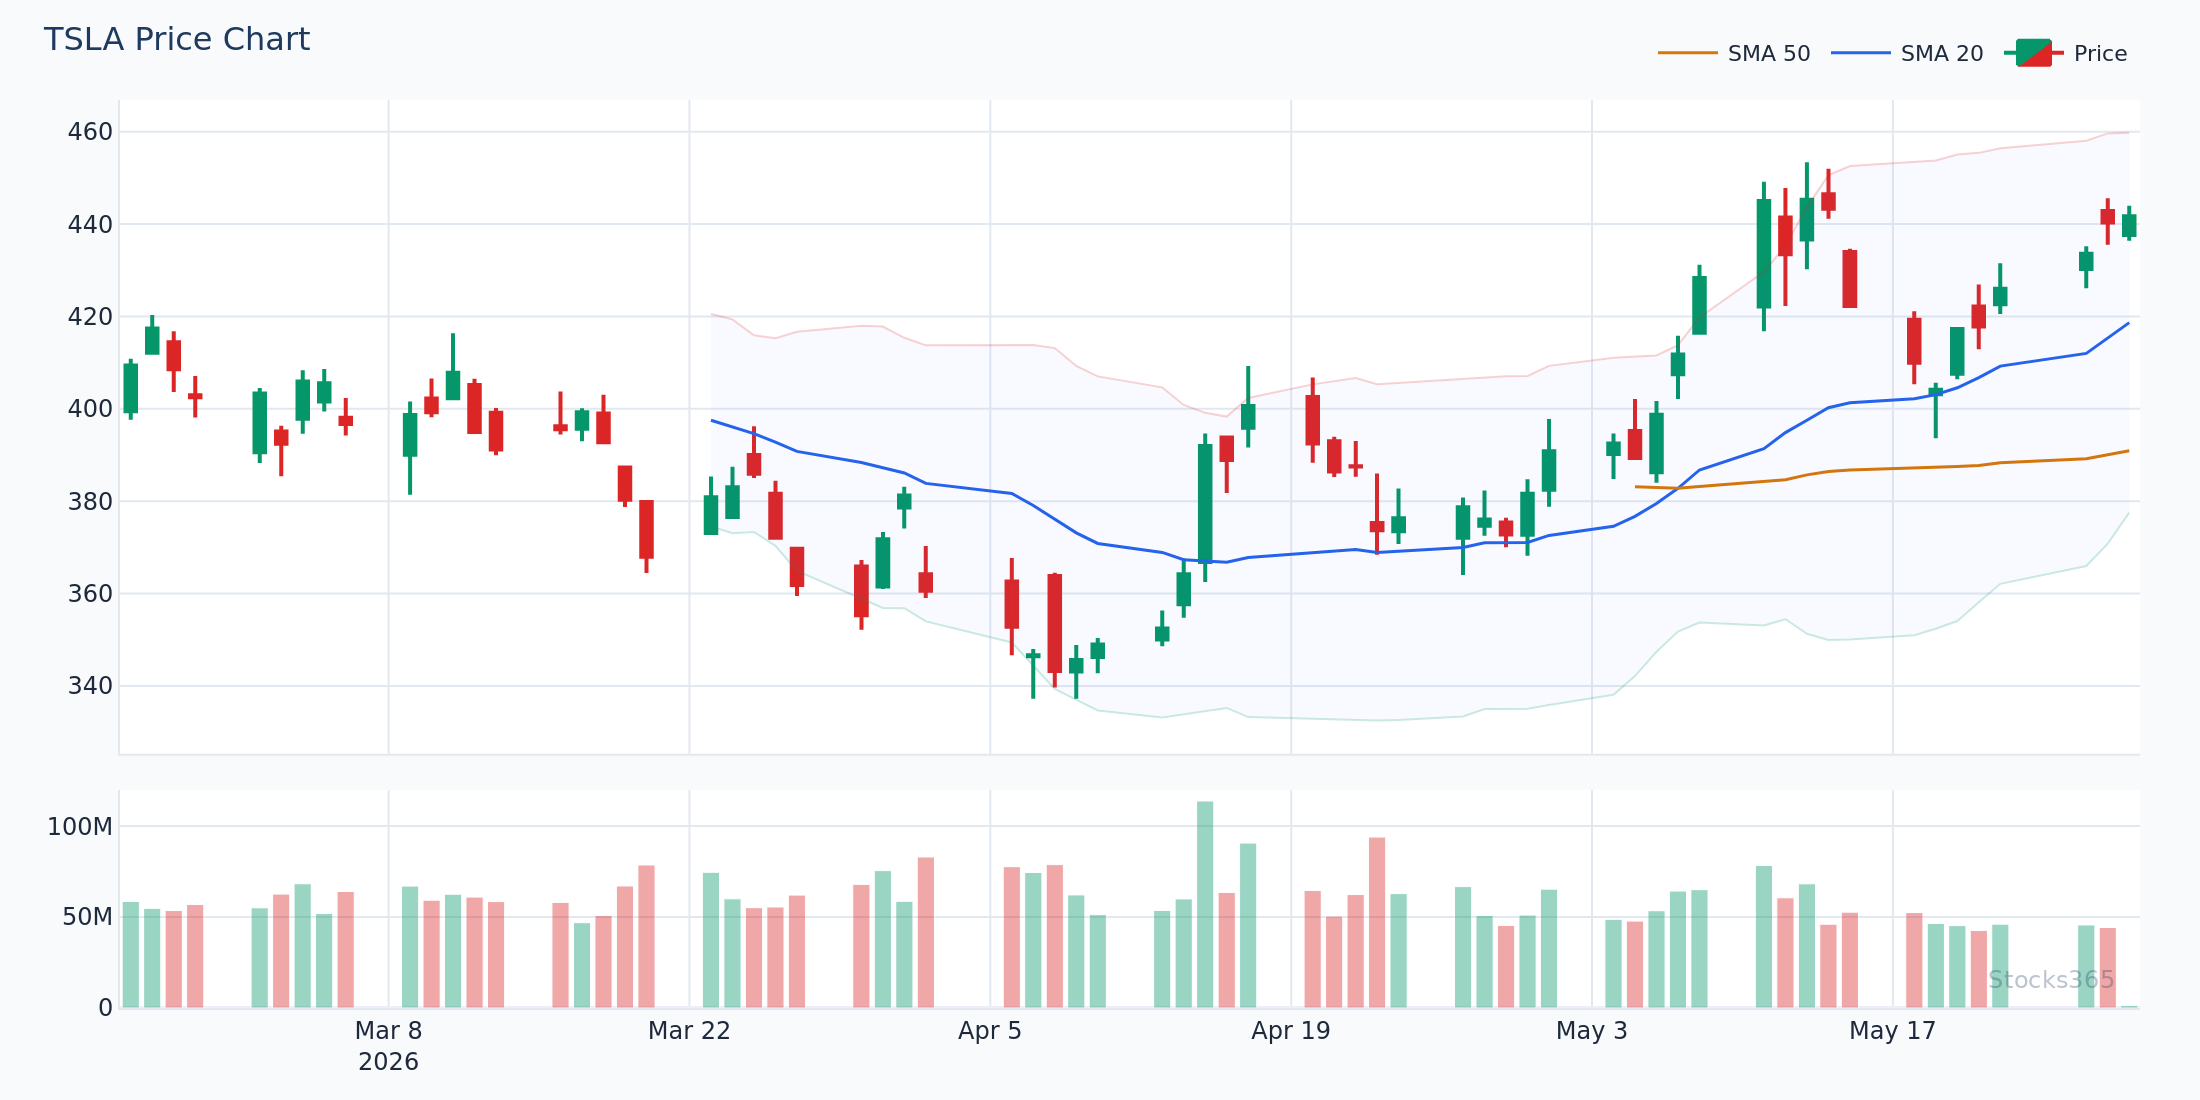
This chart illustrates a textbook RSI pullback to the 40-50 zone while price remains above a rising 20-period moving average — a high-probability continuation setup in trending conditions. When RSI bounces from the 45-50 zone and reclaims 60, it typically confirms that the trend is resuming rather than reversing. The setup is invalidated if RSI breaks below 40 and price closes beneath the 20-period moving average on the same candle.
When to Use Stochastic Over RSI
Ranging Markets and Mean Reversion
When price is consolidating between clear boundaries, stochastic is your tool. A %K cross above %D from below the 20 level, combined with a price bounce from a visible support zone, is one of the cleanest range-trade entries available.
Forex Markets
The data is clear. Stochastic oversold signals in forex hit a 57.0% win rate in our backtests. Currency pairs tend to range more than equities, which plays directly into stochastic's strengths. If you're building a forex strategy, stochastic deserves the primary seat. For a complementary momentum approach in currency markets, also consider the strategies covered in our MACD in Forex Trading guide.
Short-Term and Intraday Trading
Stochastic's sensitivity makes it better suited for shorter holding periods. Day traders who need quick entry signals in liquid markets benefit from stochastic's faster reaction time compared to the smoother RSI.
For a step-by-step walkthrough of how to actually read stochastic signals in live market conditions, see our guide: How to Read the Stochastic Oscillator: Step-by-Step.
Combining Both Indicators: The Right Way
"Use both" is lazy advice. Here's the right way to combine them.
Use RSI to define the regime. If RSI is trending above 50 and sloping upward, you're in a bullish momentum environment. In that environment, ignore stochastic overbought signals entirely — they're noise. Only act on stochastic oversold readings that align with RSI still holding above 50.
Conversely, if RSI has broken below 50 and is trending downward, you're in a bearish regime. Stochastic overbought signals become meaningful short entries when RSI confirms the downtrend. The two indicators work best as a filter pair — RSI sets the context, stochastic finds the timing.
This layered approach also complements trend confirmation methods. For example, pairing this dual-indicator system with a moving average framework can sharpen your entry precision significantly. The Moving Average Crossover Strategy guide and the Triple Moving Average Strategy both integrate naturally with momentum indicator signals to reduce false entries.
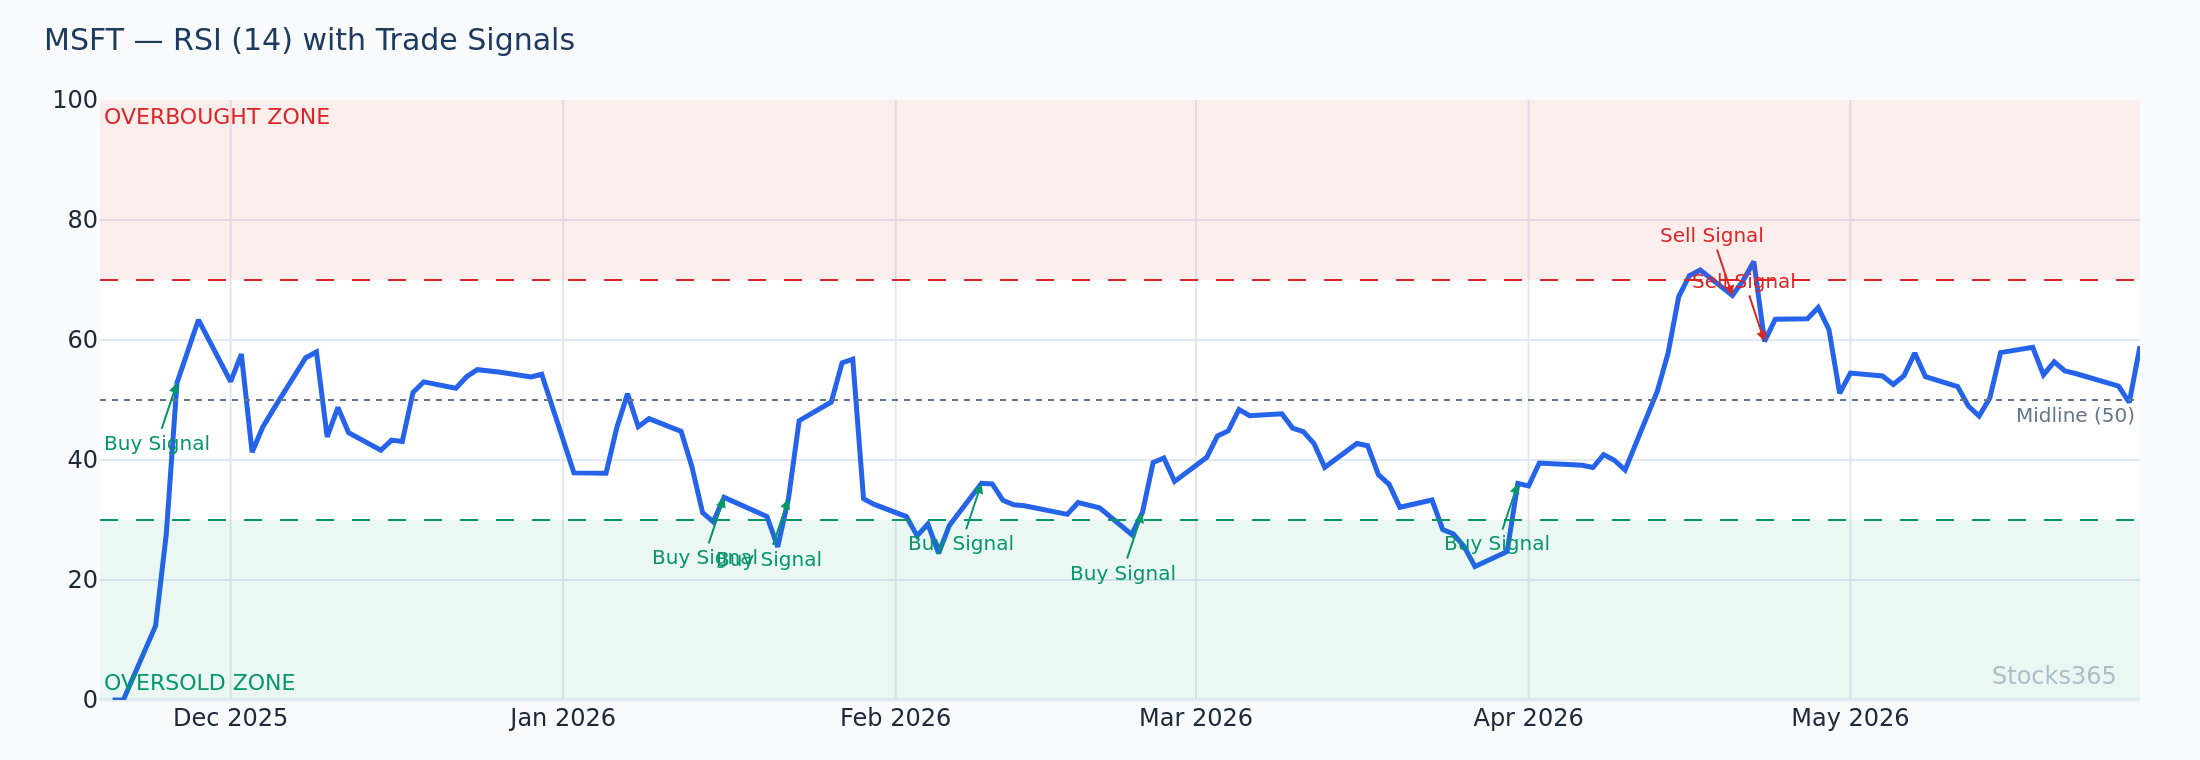
This chart demonstrates the combined approach: RSI holding above 50 establishes a bullish regime, and the stochastic %K crossing up through 20 triggers the entry — aligning timing with trend direction. When both conditions are met simultaneously, the probability of follow-through improves compared to using either indicator alone. The setup breaks down if RSI crosses below 50 before the stochastic entry fires, which signals a regime shift and invalidates the bullish bias.
Common Combinations with Other Indicators
RSI + Bollinger Bands
RSI divergence combined with a Bollinger Band squeeze breakout is a high-conviction setup. When RSI shows bearish divergence as price tags the upper Bollinger Band, and band width is at a multi-month low, the subsequent expansion often produces significant moves. For more on how Bollinger Bands behave in real market conditions, the Bollinger Bands Case Study provides a detailed breakdown. For a complete integration strategy, the Moving Average + Bollinger Bands guide is worth your time.
Stochastic + Volume
Stochastic oversold signals carry more weight when accompanied by a volume surge — at least 1.5x to 2x average daily volume on the reversal candle. Without volume confirmation, stochastic bounces from oversold territory frequently fail to follow through meaningfully.
What to Watch For
- Stochastic %K crosses above %D from below the 20 level in forex pairs during ranging conditions — especially when the price has held a visible horizontal support zone for two or more touches. This setup produces the most consistent results in our dataset, with a 57.0% win rate in forex markets.
- RSI pullbacks to the 40-50 zone in strong uptrends — when a stock is trending above its rising 50-period moving average and RSI dips to 45-50 without breaking lower, that zone frequently acts as dynamic support for continuation trades. Volume contraction during the pullback strengthens the setup.
- Bearish RSI divergence on higher timeframes after a 15-25% rally — when the weekly chart shows price making new highs but RSI failing to confirm with a higher high, the probability of a multi-week consolidation or reversal increases substantially. Use the daily stochastic to time the short entry rather than acting on the divergence signal alone.
- Stochastic overbought readings in crypto during low-volatility compression phases — our data shows crypto stochastic overbought signals hit 58.9% win rate. When crypto consolidates for multiple weeks and stochastic enters overbought territory on expanding volume, the breakout continuation trade is statistically favorable.
- Simultaneous RSI and stochastic oversold alignment on daily charts — when both RSI drops below 30 and stochastic %K drops below 20 at the same time, the confluence of two independent oversold readings signals extreme short-term pessimism. Historically, this combination precedes sharper mean-reversion bounces than either signal alone.
How Stocks365 Uses This
Stocks365's trust score system integrates both RSI and stochastic oscillator readings as part of its 12+ indicator framework. Neither indicator operates in isolation within the platform. RSI momentum state contributes to the regime scoring layer — which evaluates whether current price behavior is consistent with a trending or mean-reverting environment. Stochastic position (%K and %D relationship, overbought/oversold status) feeds into the agreement scoring layer, which measures how many independent indicators are aligned in the same directional bias.
When both RSI and stochastic agree — for example, both signaling oversold conditions simultaneously — the trust score reflects a higher level of indicator agreement, which historically correlates with stronger signal reliability. You can see these trust scores applied to live signals directly on the Stocks365 signals dashboard, where each signal displays its agreement score, regime context, and volatility environment in a single view.
Key Takeaways
- RSI measures momentum velocity; stochastic measures price position within a range. They are not interchangeable.
- RSI performs better in trending markets and is the preferred tool for large-cap stock momentum setups.
- Stochastic performs better in ranging markets and is especially effective in forex — our backtests show a 57.0% win rate on stochastic oversold signals in forex across 8,204 signals.
- Stochastic overbought signals in crypto show the highest win rate in that category at 58.9%, making it a preferred tool for crypto breakout continuation setups.
- The best combined approach: use RSI to define the market regime, use stochastic to time the entry within that regime.
- Neither indicator alone produces a reliable edge without context — asset class, timeframe, and market structure all determine which signal to trust.
- Stocks365's trust score system integrates both indicators across its agreement and regime scoring layers, surfacing only the highest-conviction setups on the signals dashboard.