

What Is the Stochastic RSI Indicator?
The Stochastic RSI (StochRSI) is a momentum oscillator developed by Tushar Chande and Stanley Kroll in their 1994 book The New Technical Trader. It takes the concept of the traditional Stochastic Oscillator and applies it directly to RSI values — rather than to raw price data. The result is a faster, more sensitive indicator that can identify overbought and oversold conditions with greater precision.
If you're already familiar with the standard RSI, think of the Stochastic RSI as an RSI of an RSI. It measures where the current RSI reading sits relative to its own high-low range over a defined lookback period. This double-layer calculation makes it exceptionally responsive to short-term momentum shifts — a quality that both day traders and swing traders prize.
For a solid foundation before diving deeper, read our guide on What Is RSI? The Complete Beginner's Guide to understand the parent indicator first.
How the Stochastic RSI Formula Works
Understanding the math behind the Stochastic RSI demystifies its behavior on your charts. The formula is straightforward once you grasp the RSI foundation it builds on.
The Stochastic RSI Formula
The core formula is:
StochRSI = (RSI – Lowest RSI) / (Highest RSI – Lowest RSI)
Where:
- RSI = The current RSI value for the period
- Lowest RSI = The lowest RSI value over the lookback period (typically 14 periods)
- Highest RSI = The highest RSI value over the same lookback period
The output oscillates between 0 and 1 (or 0 and 100 when scaled). A reading of 0 means the RSI is at its lowest point in the lookback window; a reading of 1 (or 100) means it's at its highest. For a detailed breakdown of how the underlying RSI is constructed, see our article on How RSI Is Calculated: Formula Explained Step by Step.
Default Settings and Parameters
Most trading platforms default to the following settings:
- RSI Period: 14
- Stochastic Period: 14
- %K Smoothing: 3
- %D Smoothing: 3
The %K line is the raw Stochastic RSI value, and %D is a moving average of %K — functioning as a signal line, similar to how MACD uses a signal line. When %K crosses above %D, it generates a bullish signal; when it crosses below, a bearish one.
Adjusting these settings can significantly change behavior. Shorter periods create more signals (and more noise), while longer periods produce fewer but potentially more reliable signals. Our deep-dive on RSI Settings: Master the Best Period for Your Strategy offers extensive guidance on tuning periods for different trading styles.
Reading Stochastic RSI Signals: Overbought and Oversold Zones
The Stochastic RSI oscillates between 0 and 100. The two critical threshold zones are:
- Overbought zone: Above 80 — signals that the asset may be due for a pullback or reversal
- Oversold zone: Below 20 — signals that the asset may be due for a bounce or reversal to the upside
However, just like with the standard RSI, context is everything. In a strong uptrend, the Stochastic RSI can remain overbought for extended periods. Blindly selling every time it crosses 80 would wipe out gains in a bull run. This is why combining zone readings with trend context, price action, and other confluence factors is essential.
For a broader look at how overbought and oversold zones work in practice, explore our guide on RSI Overbought and Oversold Levels: Master the Signals.
Stochastic RSI Trading Strategies
The true power of the Stochastic RSI emerges when you deploy it within a structured trading strategy. Below are four proven approaches used by active traders in 2026.
Strategy 1: Oversold Bounce in an Uptrend
This is arguably the most reliable application of the Stochastic RSI. The logic: you only take long entries when the broader trend is bullish, and you use StochRSI oversold readings to time a low-risk entry on a pullback.
Example: Imagine MSFT is trading in a clear uptrend, with price above its 50-day and 200-day moving averages. Price pulls back to a key support zone around $420. Simultaneously, the Stochastic RSI dips below 20, with %K crossing back above %D from the oversold zone. This crossover in the oversold zone, aligned with a strong uptrend and price support, is a high-probability long signal. A trader might enter at $421, place a stop-loss below the recent swing low at $415, and target the prior high near $438 — a risk/reward ratio of approximately 1:2.8.
Key conditions:
- Price is above a major moving average (50-day or 200-day)
- StochRSI drops below 20
- %K crosses above %D while still in oversold territory
- Price is near a recognized support level
Strategy 2: Overbought Rejection in a Downtrend
The mirror image of the first strategy. When price is in a confirmed downtrend, Stochastic RSI overbought readings offer short-entry opportunities during countertrend rallies.
Example: Consider TSLA in a sustained downtrend, trading below its 50-day moving average. A relief rally pushes StochRSI above 80. When %K crosses back below %D from the overbought zone — particularly if price is rejecting a known resistance level around $185 — a short entry becomes compelling. Stop-loss above the resistance at $191, with a target at the recent swing low near $168, creates a clean risk/reward setup.
Strategy 3: %K and %D Crossover Signals
The crossover between the %K and %D lines generates actionable signals independent of zone readings. These are particularly useful in trending markets where StochRSI may not reach extreme levels.
- Bullish crossover: %K crosses above %D — consider a long entry
- Bearish crossover: %K crosses below %D — consider a short entry or exit longs
Crossovers near the midline (50) in trending markets can signal continuation moves rather than reversals. The key is to align the crossover direction with the prevailing trend.
Strategy 4: Stochastic RSI Divergence
Divergence between the Stochastic RSI and price is one of the most powerful signals the indicator generates. When price makes a new high but StochRSI fails to confirm with a new high, bearish divergence is forming. When price makes a new low but StochRSI registers a higher low, bullish divergence is building.
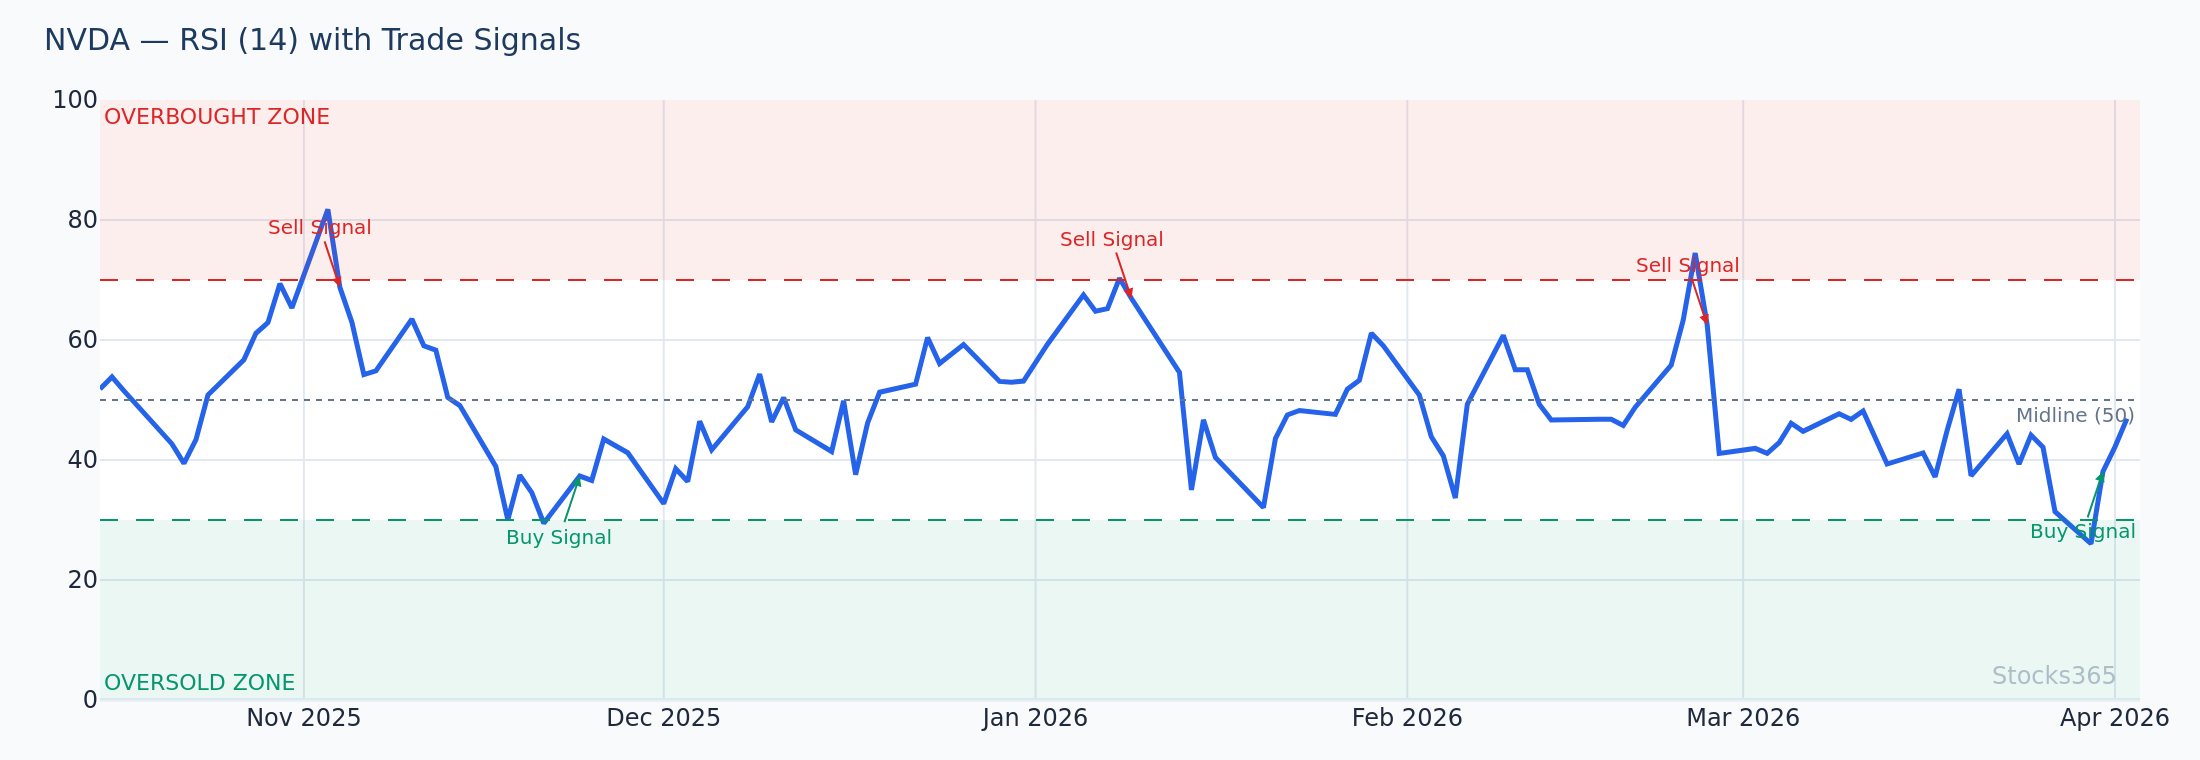
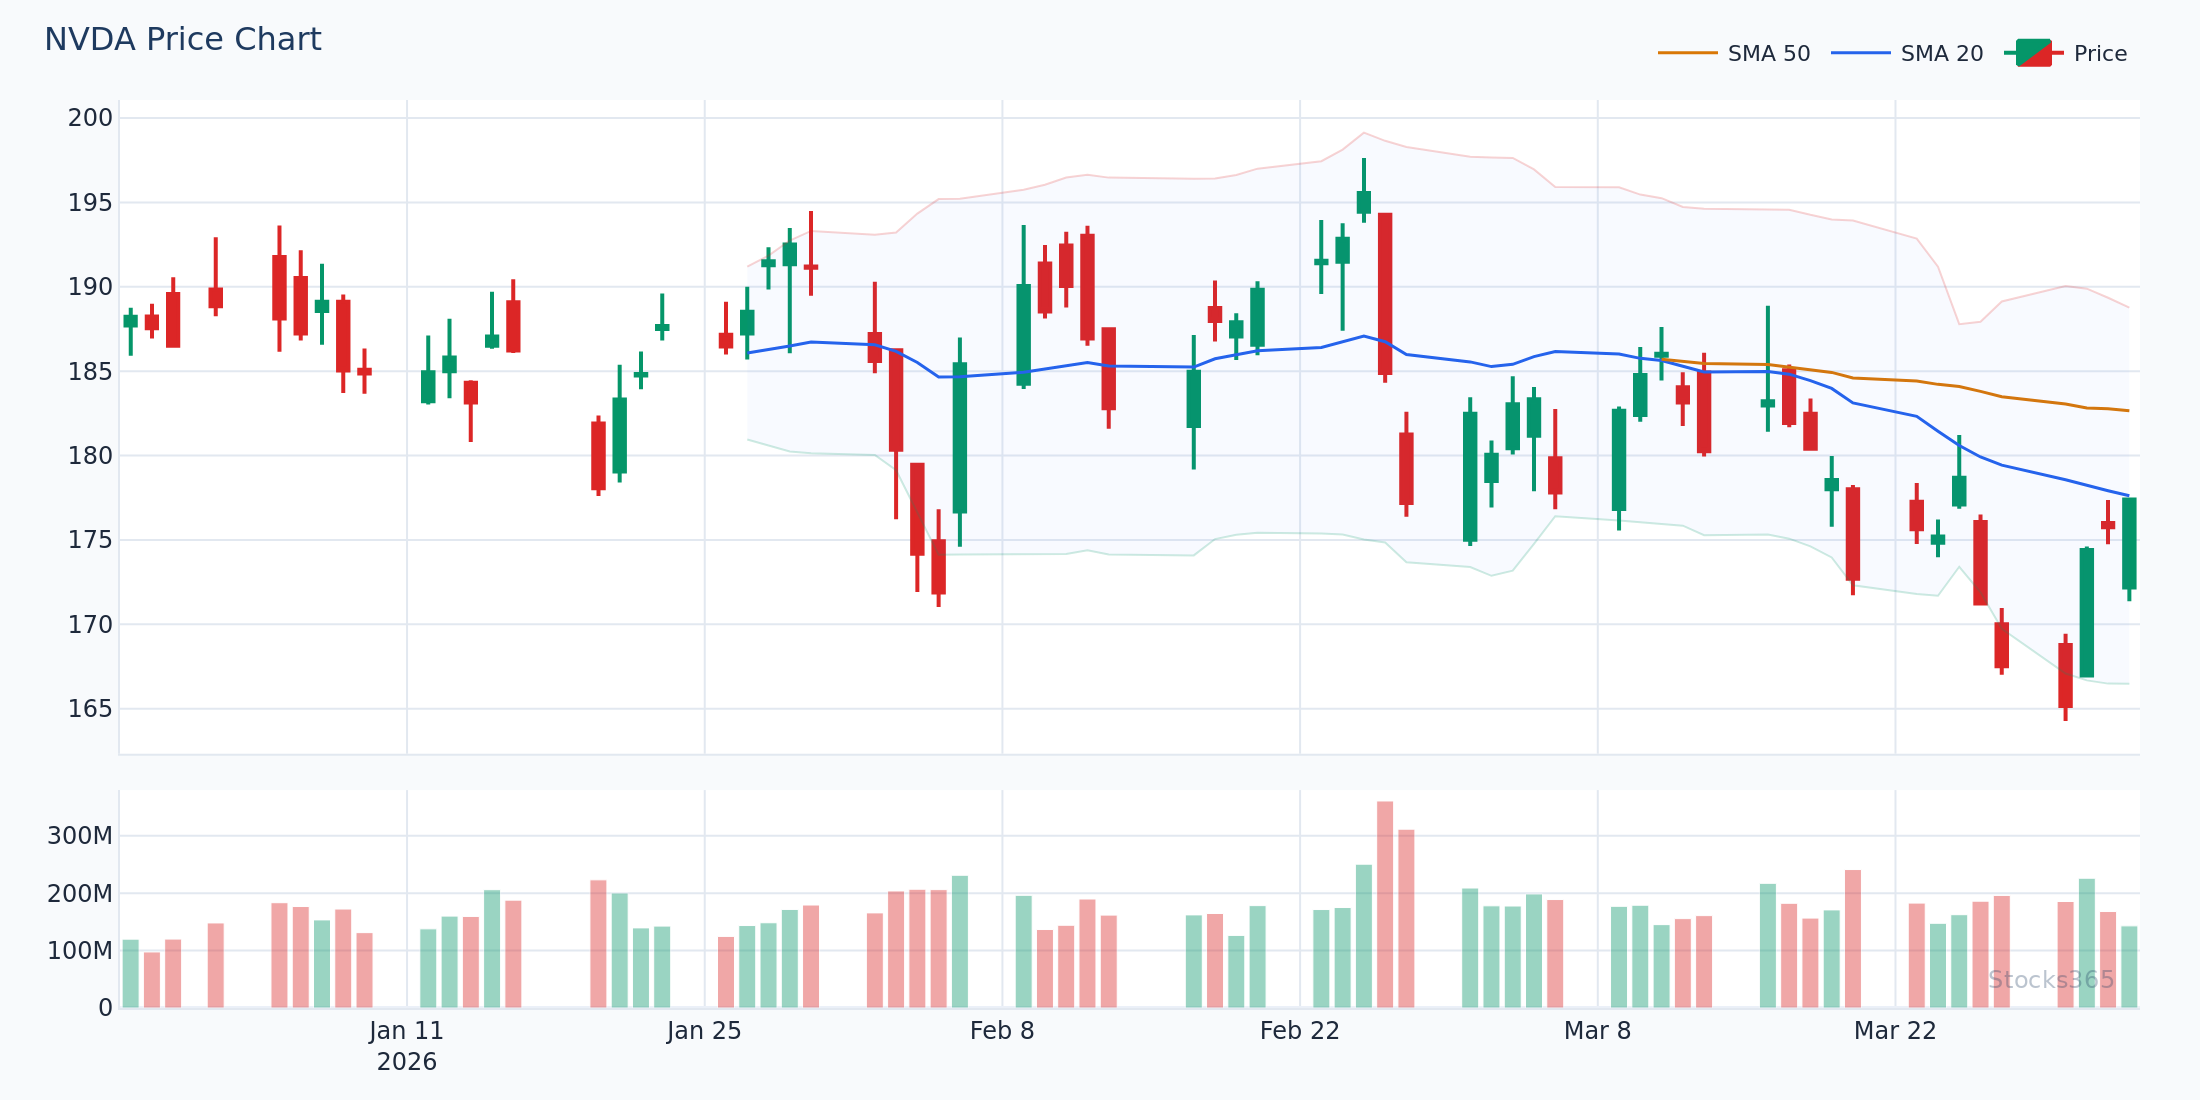
Example: NVDA makes a new 52-week high at $165, but the Stochastic RSI prints a lower high compared to the previous price peak. This divergence warns of weakening momentum even as price advances — a sign that the rally may be losing steam. Traders can use this to tighten stops on longs or prepare for a short position once price confirms with a breakdown.
Divergence analysis is a rich topic. For deeper insight, read our comprehensive articles on RSI Divergence Explained: Master Bullish & Bearish Signals and Hidden RSI Divergence: The Advanced Signal Most Traders Miss.
Stochastic RSI vs Standard RSI: Key Differences
Many traders wonder whether they should use the standard RSI or the Stochastic RSI. The honest answer: both have their place, and understanding their differences helps you choose wisely.
Sensitivity and Signal Frequency
The Stochastic RSI is significantly more sensitive than the standard RSI. It generates overbought and oversold signals far more frequently, which is both a strength and a weakness:
- More signals mean more trading opportunities — ideal for active traders and scalpers
- More false signals also result, demanding tighter filters and confirmation rules
The standard RSI, by contrast, is more measured. It reaches extreme levels less often, which can make its signals more significant when they do appear — but may cause traders to miss short-term opportunities.
Best Use Cases for Each
- Stochastic RSI: Short-term trading, scalping, intraday setups, volatile assets
- Standard RSI: Swing trading, longer-term analysis, identifying major trend exhaustion
For a full comparison of these two oscillators and how to choose between them, see our guide RSI vs Stochastic Oscillator: The Essential Guide.
Combining Stochastic RSI with Other Indicators
The Stochastic RSI rarely performs best in isolation. Pairing it with complementary tools sharpens signal quality and reduces false entries.
Stochastic RSI + Moving Averages
Using a 50-day or 200-day simple moving average as a trend filter is one of the cleanest combinations available. Only take StochRSI long signals when price is above the SMA; only take short signals when price is below. This single rule eliminates a large proportion of counter-trend false signals.
Stochastic RSI + Bollinger Bands
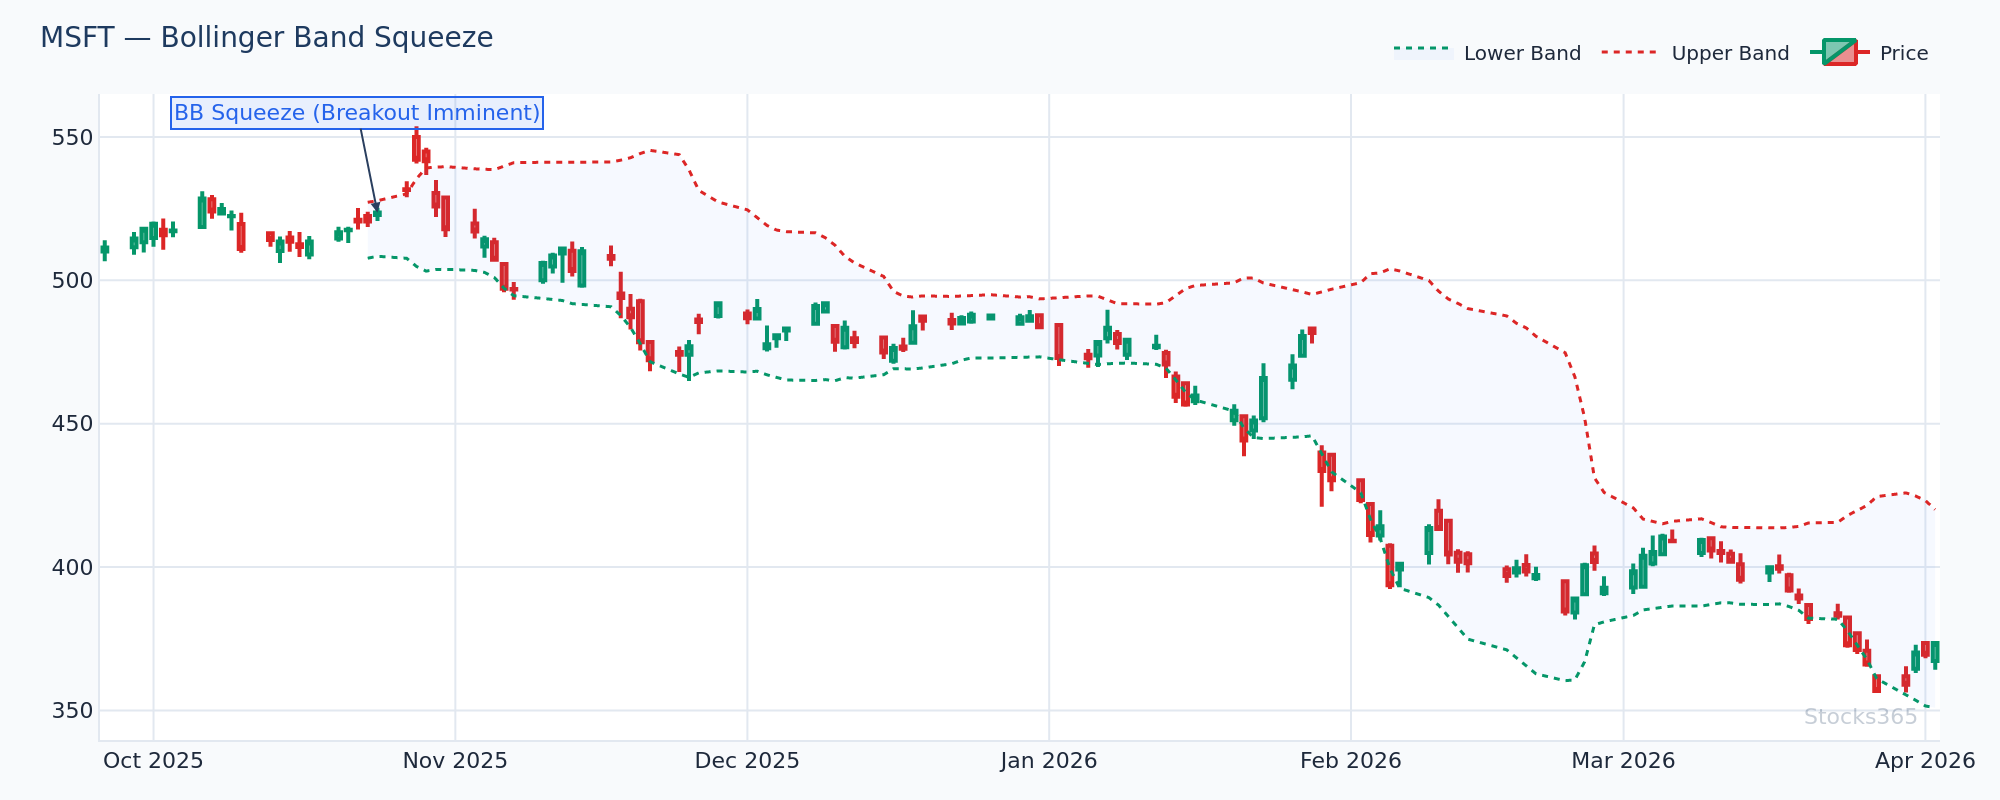
When Bollinger Bands are squeezing (low volatility), the Stochastic RSI can help anticipate the direction of the eventual breakout. If StochRSI is building momentum from oversold levels during a squeeze, the breakout is more likely to be bullish — and vice versa.
Stochastic RSI + Volume Analysis
Volume provides the fuel behind price moves. An oversold StochRSI reading accompanied by a surge in buying volume is far more compelling than an oversold reading on declining volume. Always check volume context when acting on extreme StochRSI readings.
Stochastic RSI + Support and Resistance
Price levels respect geometry. An oversold StochRSI reading that coincides with price touching a major support zone (previous swing low, round number, Fibonacci retracement level) creates multi-layer confluence — the sweet spot every professional trader seeks.
Common Mistakes Traders Make with Stochastic RSI
Even experienced traders misuse the Stochastic RSI. Avoiding these pitfalls can save significant capital.
Trading Every Crossover Without Context
The Stochastic RSI generates frequent crossovers. Acting on every single one — without trend context, support/resistance awareness, or volume confirmation — leads to overtrading and death by a thousand cuts. Be selective. Quality over quantity always wins in trading.
Ignoring the Broader Trend
An oversold StochRSI reading in a powerful downtrend is not a buy signal — it's a warning that the asset is in a waterfall decline. Always establish the macro trend before interpreting micro-level StochRSI signals. Our ultimate guide on using RSI in trading covers trend alignment in depth.
Using Default Settings for All Markets
The default 14-period setting works reasonably well across many markets, but it's not universal. Highly volatile assets like crypto may benefit from shorter periods; slower-moving blue-chip stocks might reward longer settings. Always test and adapt.
Neglecting Risk Management
No indicator — including the Stochastic RSI — is right 100% of the time. Every trade requires a stop-loss. Define your risk before entering any position, and never let a losing trade exceed your predetermined maximum loss.
Using Stochastic RSI on the Stocks365 Platform
Stocks365 makes applying the Stochastic RSI to your trading workflow seamless and intelligent. The platform's Trust Score system aggregates multiple technical factors — including momentum indicators like the Stochastic RSI — to produce a composite signal strength rating for any given stock. Rather than manually scanning hundreds of charts, you can identify high-probability setups instantly.
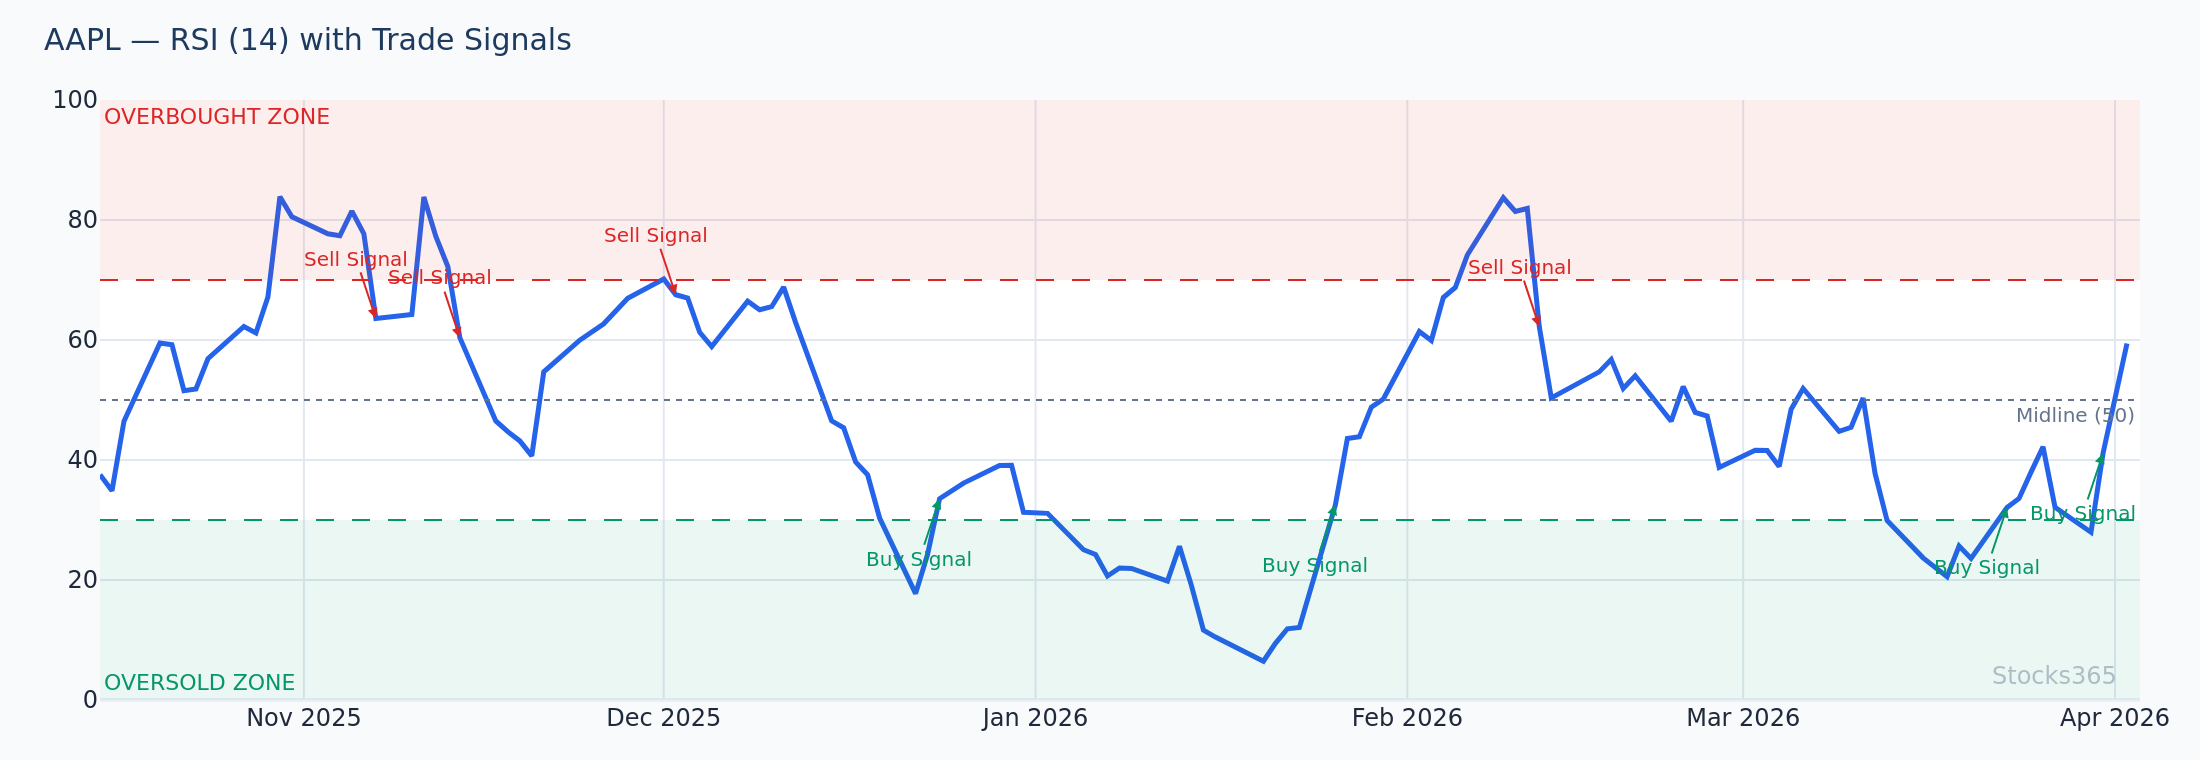
For example, when you visit the AAPL signal page, you'll see a live technical breakdown that incorporates momentum, trend, and volatility readings. The Trust Score reflects whether the Stochastic RSI and other indicators are aligned in the same direction — a critical filter that separates strong setups from noise.
Head to the Stocks365 signals dashboard to scan the market for stocks where Stochastic RSI is triggering overbought or oversold conditions right now, with Trust Score backing for added confidence.
Key Takeaways
📊 Stochastic RSI — What You Need to Remember:
- The Stochastic RSI applies the Stochastic Oscillator formula to RSI values, creating a faster, more sensitive momentum indicator
- It oscillates between 0 and 100; readings above 80 are overbought, below 20 are oversold
- The %K and %D crossovers within overbought/oversold zones generate the most reliable entry signals
- Always use trend context — StochRSI signals carry far more weight when aligned with the prevailing trend
- Divergence between StochRSI and price can provide early warning of trend reversals
- Combine with moving averages, Bollinger Bands, volume, and price levels for best results
- The Stocks365 Trust Score integrates StochRSI alongside other technical signals for smarter, faster trade identification
Frequently Asked Questions
What is the difference between Stochastic RSI and regular RSI?
The standard RSI measures momentum based on raw price changes over a defined period. The Stochastic RSI goes one step further — it applies the Stochastic Oscillator formula to RSI values themselves. This makes the Stochastic RSI significantly more sensitive and faster-moving, generating overbought and oversold signals more frequently. The trade-off is a higher rate of false signals, which is why Stochastic RSI works best when combined with trend filters and other confirmation tools.
What are the best Stochastic RSI settings?
The most widely used default settings are a 14-period RSI, 14-period Stochastic, with %K smoothed at 3 and %D at 3. For short-term or intraday trading, reducing the RSI and Stochastic periods to 8 or 10 increases sensitivity. For swing trading on daily charts, the defaults are generally appropriate. Always backtest any parameter changes on the specific instrument and timeframe you plan to trade. Our RSI settings guide provides a detailed framework for optimization.
Is Stochastic RSI good for day trading?
Yes — the Stochastic RSI is one of the more popular indicators among day traders precisely because of its high sensitivity and fast response to short-term momentum changes. On 5-minute or 15-minute charts, it can identify intraday oversold/overbought extremes effectively. However, its tendency to generate false signals on lower timeframes means it must be used alongside price action analysis and a clear trend bias derived from a higher timeframe.
How do I avoid false signals with Stochastic RSI?
The most effective filters are: (1) Only take signals in the direction of the prevailing trend on a higher timeframe; (2) Require %K to cross %D within the extreme zone (above 80 or below 20) before acting; (3) Look for confirmation from price — such as a bullish engulfing candle at support or a rejection wick at resistance; (4) Incorporate volume analysis to validate momentum; and (5) Use the Stocks365 Trust Score to confirm that multiple technical factors are aligned before entering a trade.
Can Stochastic RSI be used for stocks, crypto, and forex?
Absolutely. The Stochastic RSI is a universal momentum indicator that functions across all liquid financial markets — equities, cryptocurrencies, forex pairs, commodities, and futures. Because it is derived from price data alone (via RSI), it adapts to any asset class. You may need to fine-tune the period settings for markets with different volatility profiles — for example, crypto markets often benefit from shorter periods given their rapid price fluctuations compared to large-cap stocks.