
MACD for Day Trading: How to Read Intraday Signals Like a Professional Trader
The Moving Average Convergence Divergence (MACD) indicator remains one of the most powerful tools in a day trader's arsenal in 2026 — and for good reason. Whether you're scalping 5-minute charts on NVDA or swing-trading TSLA intraday, the MACD provides a dynamic, momentum-based view of price action that few other indicators can match.
But here's the problem: most traders use MACD incorrectly. They wait for obvious crossovers, enter too late, and watch profits evaporate before they even begin. This guide will show you exactly how to configure, read, and act on MACD signals for day trading — with real chart setups, specific price examples, and strategies that actually work in today's fast-moving markets.
Key Insight: MACD isn't just a crossover indicator. When used correctly for intraday trading, it reveals momentum shifts, hidden divergences, and high-probability entry zones that most retail traders completely overlook.
What Is MACD and How Does It Work for Day Trading?
The MACD indicator was developed by Gerald Appel in the late 1970s and measures the relationship between two exponential moving averages (EMAs). For day trading purposes, understanding the mechanics is non-negotiable — you need to know why a signal fires before you act on it.
The Three Core Components of MACD
- MACD Line: The difference between the 12-period EMA and the 26-period EMA. This line responds quickly to price changes and leads signal generation.
- Signal Line: A 9-period EMA of the MACD line itself. When the MACD crosses above this line, it suggests bullish momentum; crossing below suggests bearish momentum.
- Histogram: The visual representation of the difference between the MACD line and the Signal line. Growing bars = increasing momentum; shrinking bars = momentum fading.
For day trading specifically, these default settings (12, 26, 9) work well on 15-minute and 30-minute timeframes. For faster scalping on 1-minute or 5-minute charts, many professional traders shift to a (5, 13, 4) or (8, 17, 9) configuration to reduce lag.
Best MACD Settings for Day Trading in 2026
One of the most common questions among day traders is which MACD settings to use. The answer depends on your preferred timeframe and trading style. Here's a breakdown of proven configurations:
Standard Settings (15-min to 1-hour charts)
- Fast EMA: 12 periods
- Slow EMA: 26 periods
- Signal Line: 9 periods
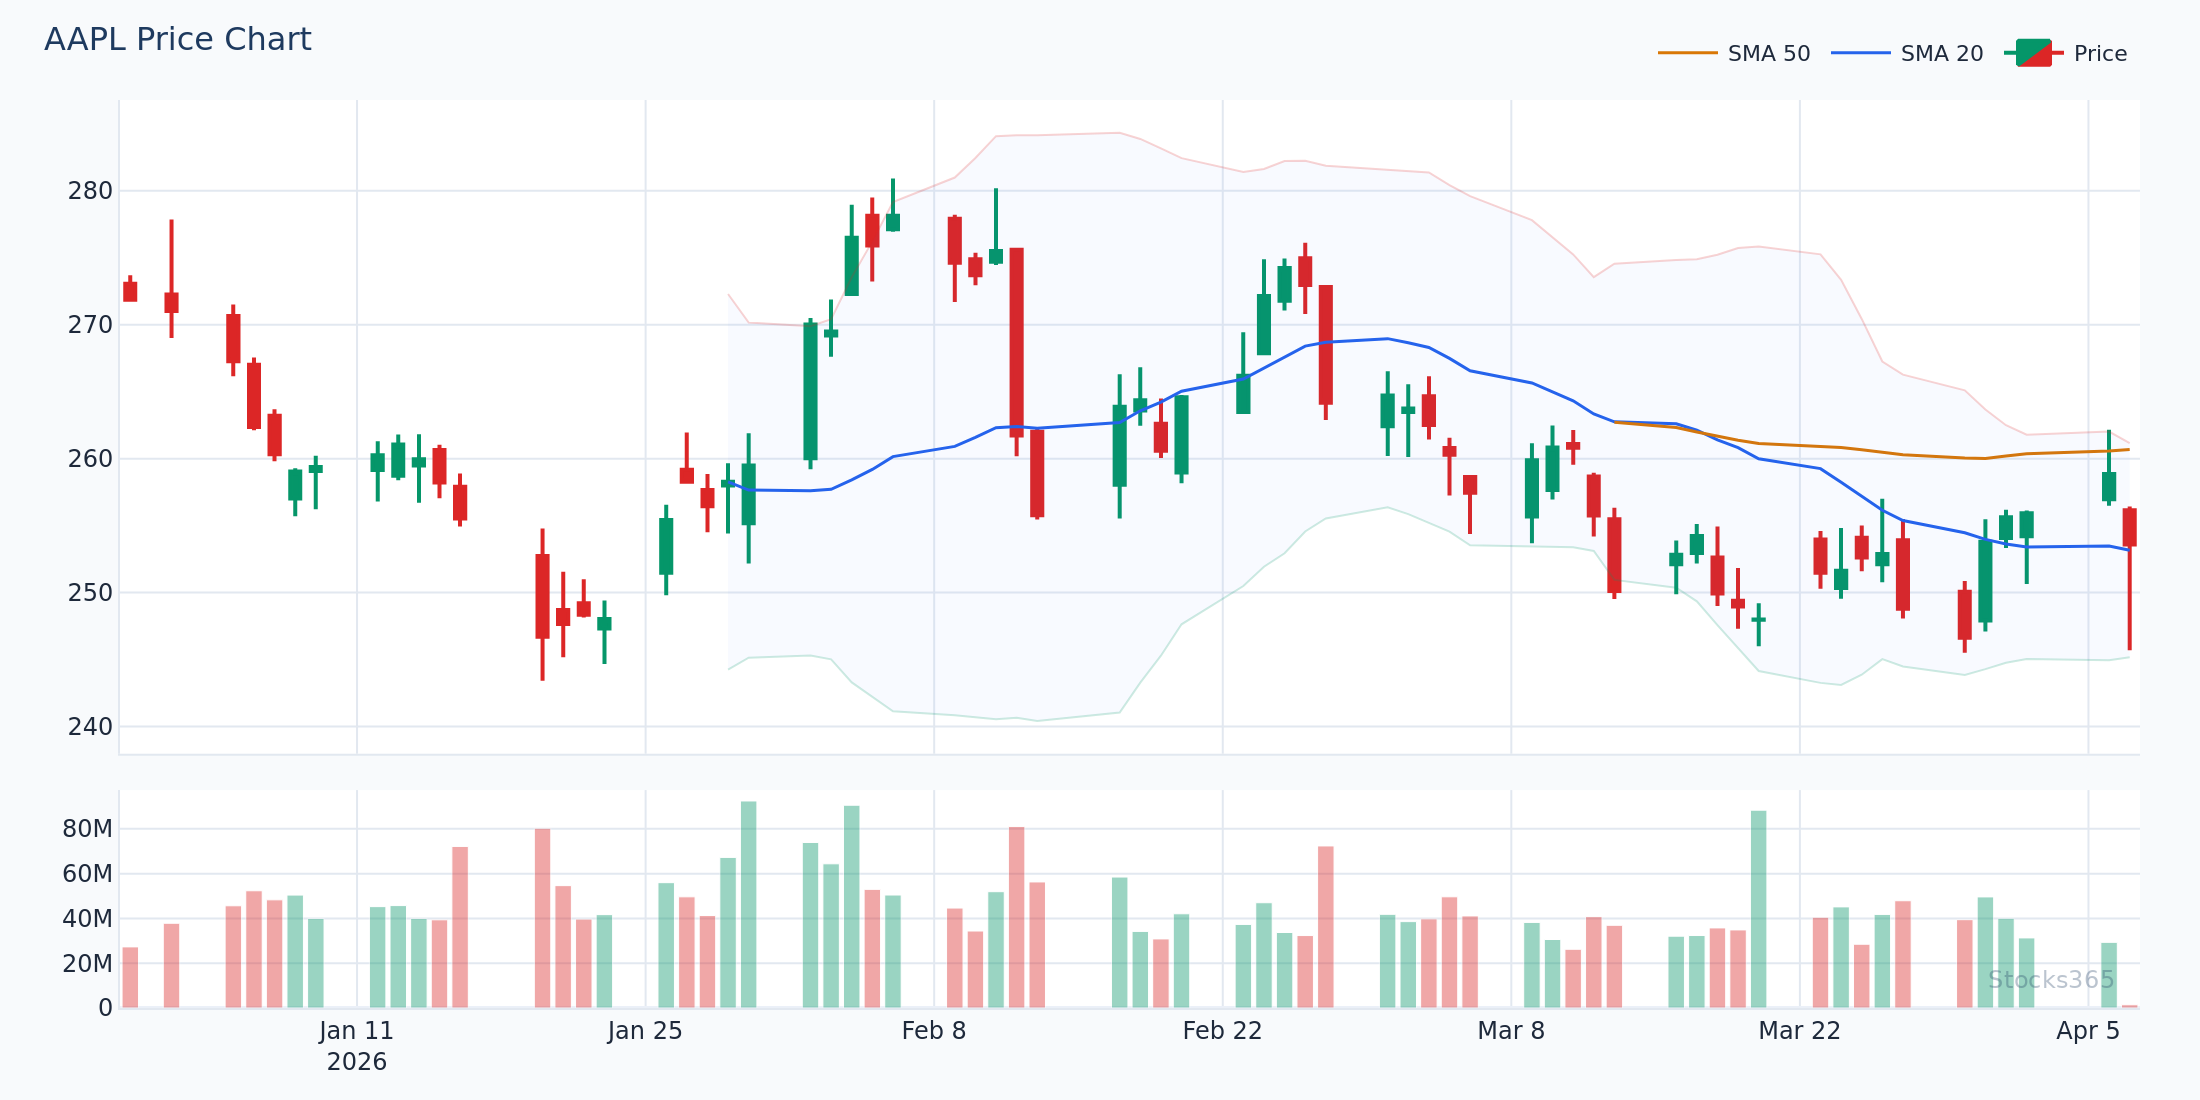
This is the default configuration on most platforms including ThinkorSwim, TradingView, and the Stocks365 signals dashboard. It balances responsiveness with reliability and works especially well for mid-cap stocks like MSFT and AAPL during the first two hours of market open.
Aggressive Settings (1-min to 5-min scalping)
- Fast EMA: 5 periods
- Slow EMA: 13 periods
- Signal Line: 4 periods
These faster settings reduce lag significantly but increase false signals. Only use these on high-volume stocks where bid-ask spreads are tight — think NVDA, TSLA, or AAPL during earnings season or major catalyst days.
Conservative Settings (30-min to daily intraday swing)
- Fast EMA: 8 periods
- Slow EMA: 21 periods
- Signal Line: 5 periods
This middle-ground approach suits traders who prefer fewer, higher-quality signals over rapid-fire entries. It pairs exceptionally well with RSI confirmation — and if you're not yet using RSI alongside MACD, check out our guide on how to use RSI in trading for a complete multi-indicator strategy framework.
The 4 Most Powerful MACD Signals for Day Trading
Understanding MACD components is just the beginning. The real edge comes from knowing which signals to prioritize and — critically — which ones to ignore.
1. MACD Bullish Crossover (Buy Signal)
The most well-known signal occurs when the MACD line crosses above the Signal line. For day trading, the context of where this crossover happens matters enormously:
- Below the zero line: Crossover in negative territory signals a potential bullish reversal — higher conviction buy signal
- Above the zero line: Crossover in positive territory confirms ongoing bullish momentum — valid for trend-following entries
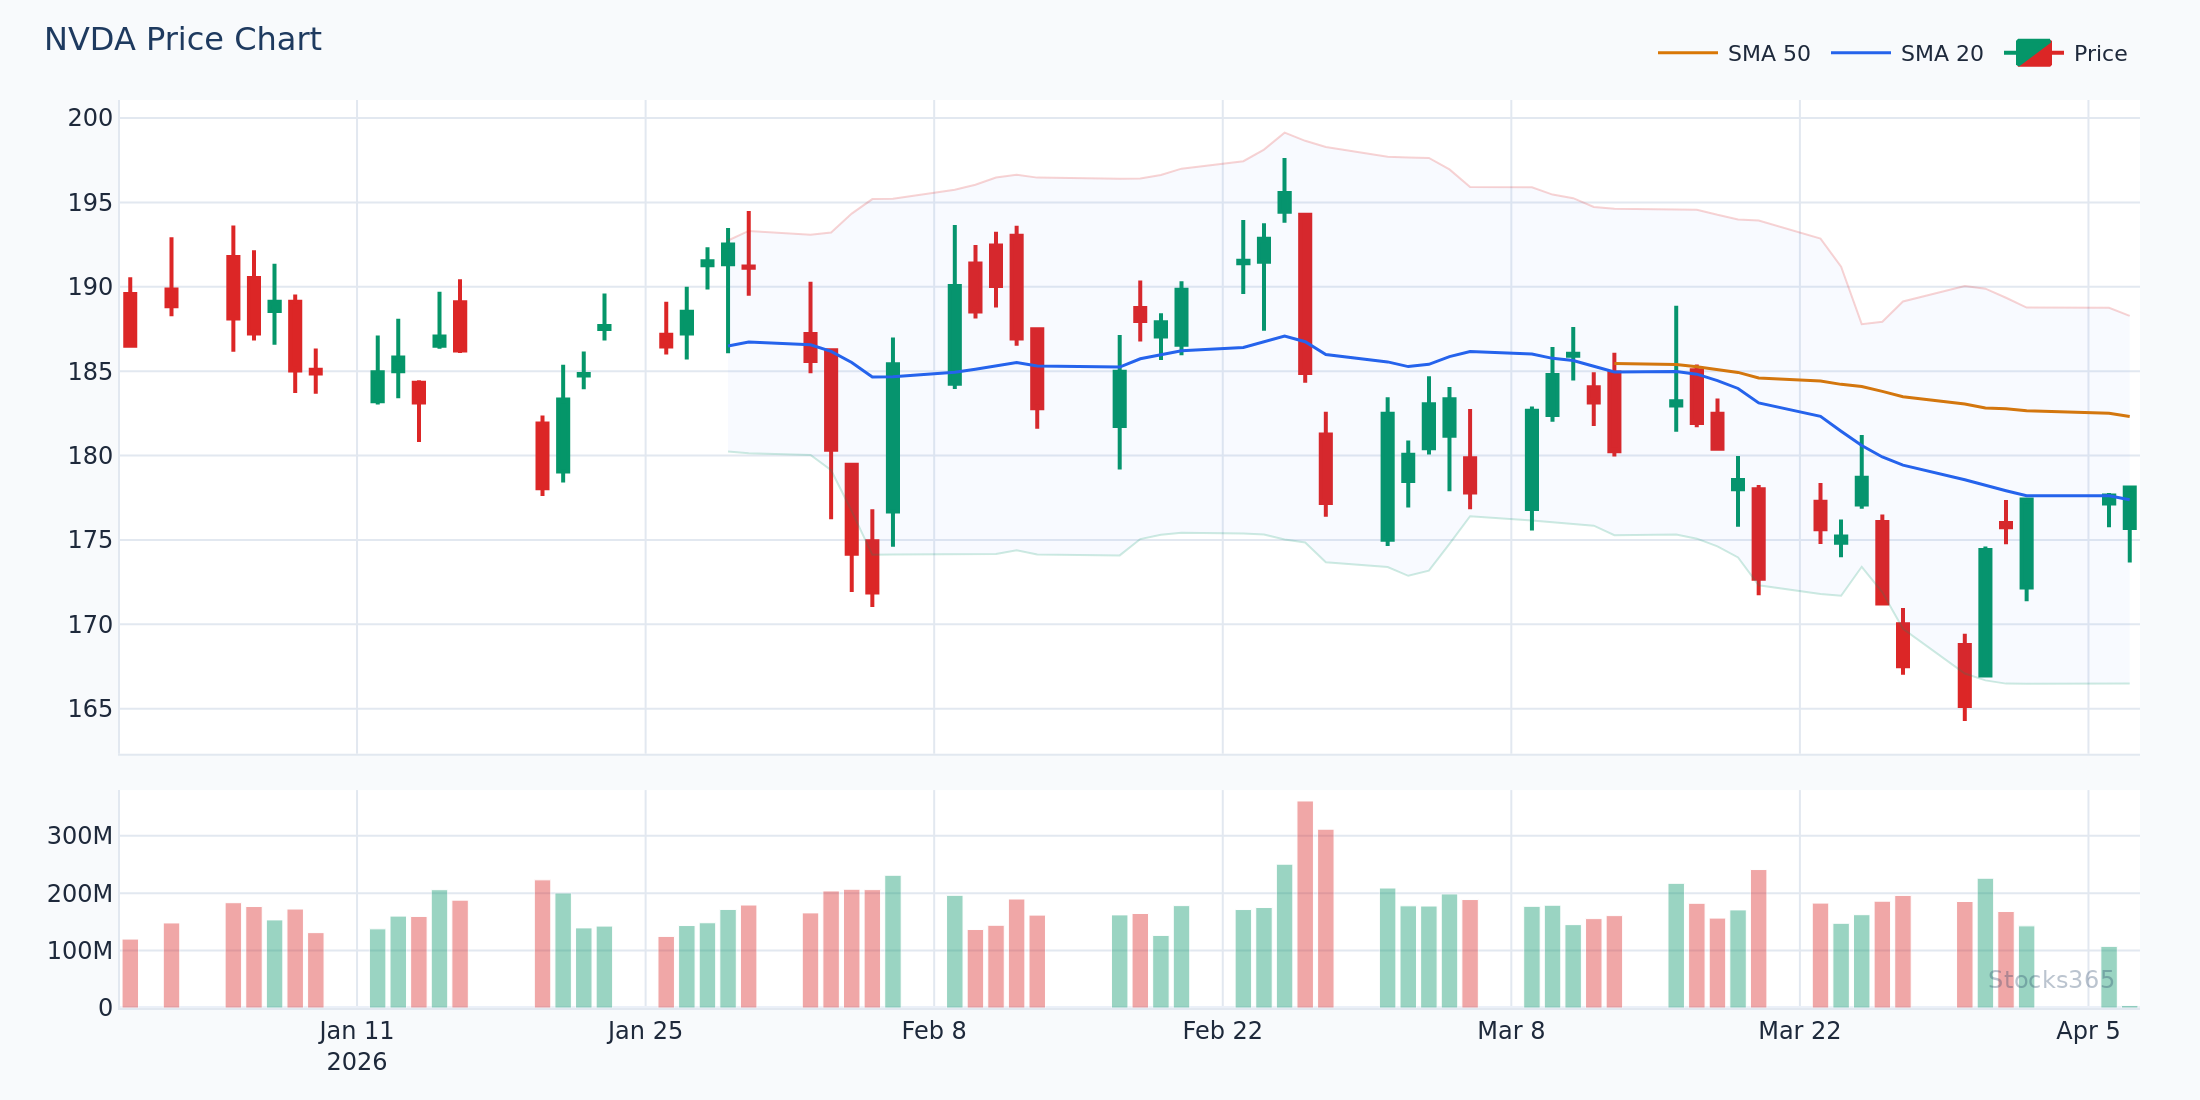
Practical Example: Imagine AAPL opens at $198.50 on a Wednesday morning in March 2026. On the 15-minute chart, the MACD line is at -0.42, the signal line at -0.58, and a crossover occurs at 10:15 AM EST. Price simultaneously bounces off the $197.80 support zone. This confluence creates a high-probability long entry at $198.70 with a stop at $197.50 and a target of $201.20 — a clean 2.1:1 reward-to-risk setup.
2. MACD Bearish Crossover (Sell/Short Signal)
The inverse: MACD line crosses below the Signal line. For short-sellers and put option traders, bearish crossovers in positive territory (above zero) are particularly powerful because they signal the exhaustion of an uptrend rather than just continuation of a downtrend.
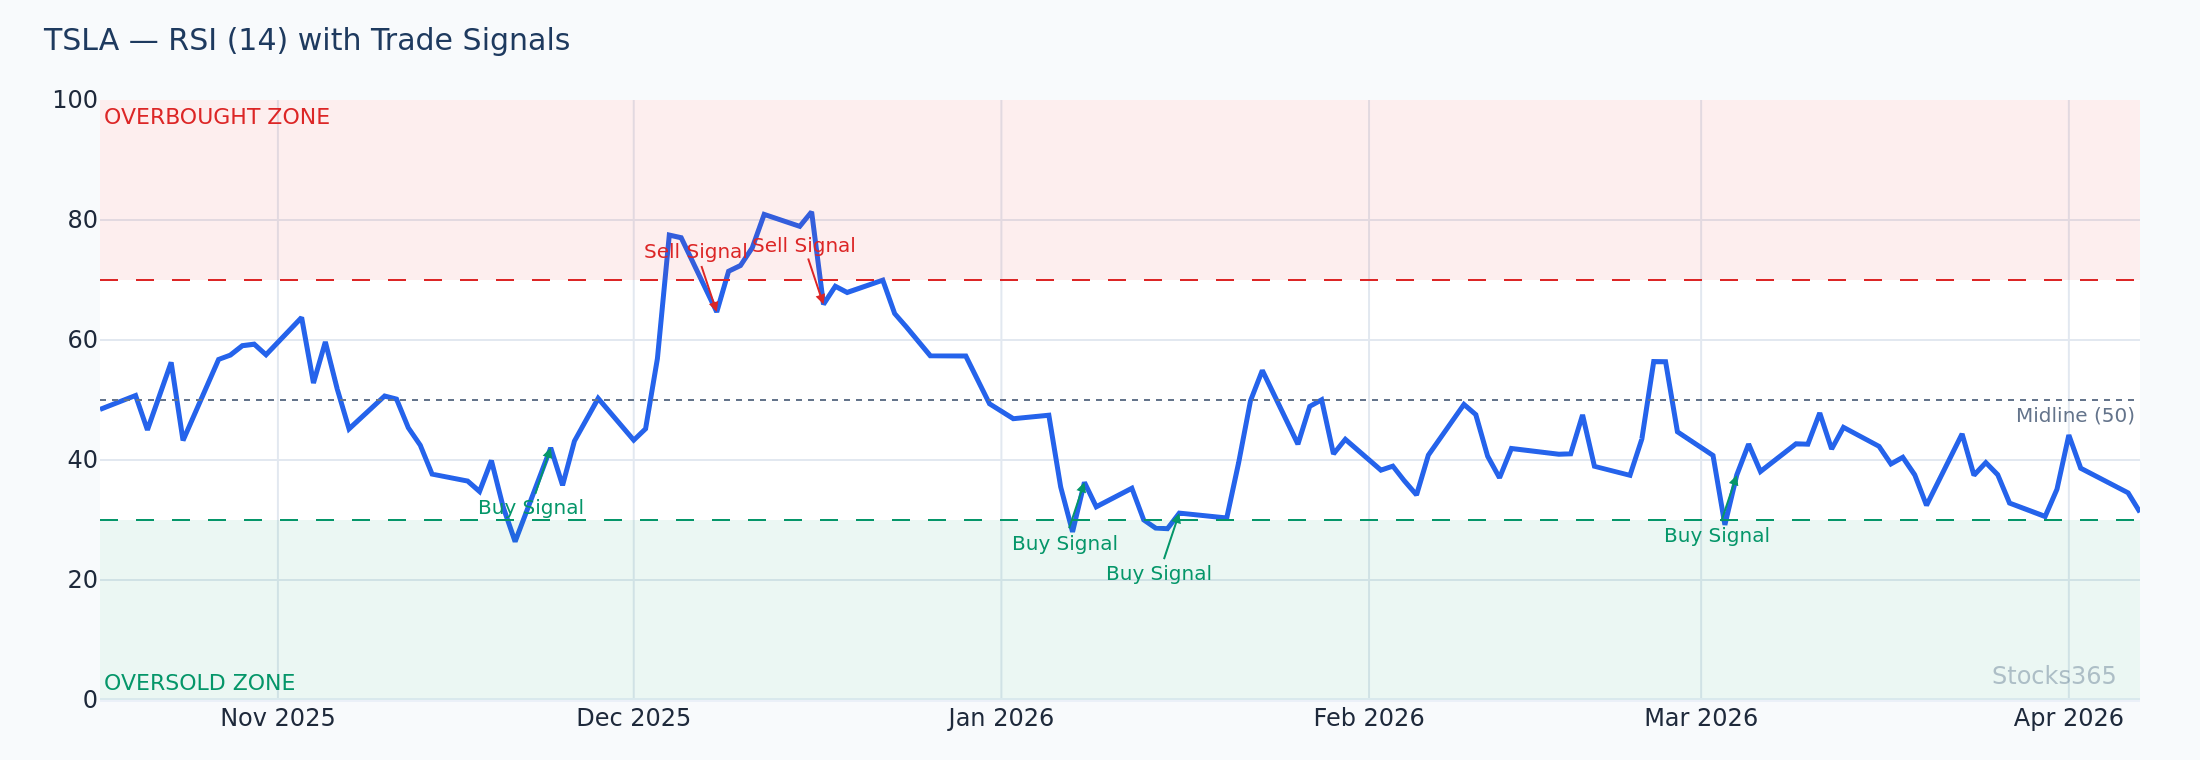
Practical Example: TSLA surges from $285 to $294 in the first 45 minutes of trading. On the 15-minute chart, a bearish MACD crossover forms at $293.40. The histogram bars that were previously expanding are now shrinking — momentum is dying. A short entry at $292.80, stop at $295.50, and target at $288.00 offers a solid intraday short setup.
3. MACD Histogram Divergence — The Advanced Signal
This is where MACD day trading goes from good to exceptional. Histogram divergence occurs when price makes a new high (or low) but the histogram bars are shorter than the previous peak — meaning momentum is weakening even as price extends.
This concept closely parallels RSI divergence, which we've covered in depth in our article on RSI divergence and bullish/bearish signals. Used together, MACD histogram divergence and RSI divergence create some of the most reliable reversal signals available to day traders.
There's also a lesser-known variation called hidden divergence — when the MACD confirms a trend continuation despite an apparent price pullback. This is the same concept as hidden RSI divergence, which we break down in detail at Hidden RSI Divergence: The Advanced Signal Most Traders Miss. Understanding both MACD and RSI versions of hidden divergence gives you a significant edge.
4. Zero Line Crossover (Trend Confirmation)
When the MACD line crosses the zero line, both EMAs have converged and re-separated in the new direction. For day traders, this is less of an entry signal and more of a trend filter:
- MACD above zero = bullish bias, look for long entries only
- MACD below zero = bearish bias, look for short entries or avoid longs
Professional day traders use zero-line positioning to avoid counter-trend trades that statistically carry much lower win rates. When the Stocks365 trust score flags a high-confidence signal on a stock like AAPL, checking whether the MACD is on the correct side of zero adds an important layer of confirmation.
MACD Day Trading Strategy: A Step-by-Step Setup
Let's walk through a complete, repeatable day trading strategy using MACD as the primary signal generator, with supporting indicators for confirmation.
Step 1 — Identify the Market Structure
Before looking at any indicator, determine whether the stock is trending or ranging on the 30-minute chart. MACD works best in trending conditions. In choppy, low-volume markets, crossover signals become unreliable noise.
Step 2 — Set Your MACD Parameters
For intraday trading on 15-minute charts, use the standard (12, 26, 9) settings. Make sure your histogram is visible and color-coded (green for positive, red for negative) for quick visual reads.
Step 3 — Wait for the Trigger Signal
Your primary MACD trigger should be one of the following:
- Bullish crossover forming below the zero line
- Histogram transitioning from negative to positive (or vice versa)
- Divergence between price and MACD histogram
Step 4 — Confirm with a Secondary Indicator
Never trade MACD signals in isolation. Use RSI as your confirmation tool. An RSI reading between 40-60 on a crossover signal suggests the move has room to run. An RSI above 70 on a bullish MACD crossover is a warning — the stock may already be overbought. For a full understanding of RSI levels, visit our guide on RSI overbought and oversold levels.
Additionally, if you're unsure about RSI basics or how to calculate it, our resources on what RSI is and how RSI is calculated will fill in the gaps quickly.
Step 5 — Define Your Risk Parameters
Set your stop-loss before entering the trade, not after. For MACD-based day trades:
- Stop-loss: Below the most recent swing low (for longs) or above the most recent swing high (for shorts)
- Target: Minimum 1.5:1 reward-to-risk ratio; 2:1 preferred
- Position size: Risk no more than 1-2% of account per trade
Step 6 — Manage the Trade Actively
Once in a MACD-confirmed trade, watch the histogram. If bars begin shrinking before your target is reached, consider taking partial profits. A shrinking histogram doesn't always mean reversal — but it does mean momentum is softening, and protecting gains is always smart intraday strategy.
MACD vs. Other Oscillators: What Day Traders Need to Know
MACD operates differently from pure oscillators like RSI or Stochastic. While RSI measures the speed and magnitude of price changes on a bounded 0-100 scale, MACD is an unbounded trend-following momentum indicator. This distinction matters for day trading:
- MACD strength: Excellent for trend direction, momentum assessment, and divergence spotting
- MACD weakness: Lags in fast-moving markets; generates false signals in sideways conditions
- RSI strength: Superior for identifying overbought/oversold conditions and precise reversal zones
For a deep comparison of how different oscillators complement each other, our article on RSI vs Stochastic Oscillator explains the nuances clearly. The best intraday traders don't choose one indicator over another — they understand which tool solves which problem.
If you want to fine-tune your RSI settings to match the speed of your MACD configuration, our guide on RSI settings and optimal periods is essential reading.
Common MACD Day Trading Mistakes to Avoid
Even experienced traders fall into these traps. Awareness is your first defense:
Mistake 1: Trading Every Crossover
In choppy markets, the MACD line and signal line will whipsaw back and forth creating a cascade of false signals. Filter these out by only trading crossovers that occur alongside meaningful price action — breakouts from consolidation, bounces from key levels, or high-volume candles.
Mistake 2: Ignoring the Histogram
Most traders focus entirely on the crossover lines and ignore the histogram — which is often the earliest warning of a momentum shift. When histogram bars start shrinking before a crossover even happens, a reversal may be incoming. This early warning can save you from entering late or holding a losing position too long.
Mistake 3: Using MACD Alone
MACD is a powerful tool, but it has a meaningful lag. Without volume confirmation, support/resistance context, or an oscillator like RSI alongside it, you're trading blind on half the relevant data. The Stocks365 signals dashboard combines multiple technical factors — including MACD momentum readings — into a composite trust score precisely because single-indicator trading underperforms multi-factor analysis.
Mistake 4: Applying Day Trading MACD Settings to Scalping
Using the default 12/26/9 settings on a 1-minute chart is a recipe for disaster. The signal lag at that speed is so significant that you'd consistently be entering after the optimal point has passed. Match your MACD parameters to your timeframe — always.
Mistake 5: Forgetting Pre-Market Context
In 2026, pre-market futures activity and overnight news can create gap conditions that render any purely technical MACD reading misleading at the open. Always check broader market context — is the S&P 500 trending or reversing? Is there a Fed announcement today? Context filters signal quality dramatically.
Key Takeaways
📊 MACD Day Trading — Summary
- MACD consists of three components: the MACD line, signal line, and histogram — each providing distinct information about momentum and trend direction
- For 15-minute day trading, the standard 12/26/9 settings work best; for scalping 1-5 minute charts, use faster settings like 5/13/4
- The four most actionable MACD signals are: bullish crossover, bearish crossover, histogram divergence, and zero-line crossover
- Always confirm MACD signals with a secondary indicator — RSI is the most powerful companion tool for filtering false signals
- Histogram divergence (price makes new extreme but histogram bars shrink) is one of the earliest and most reliable reversal warnings available to day traders
- Avoid trading MACD crossovers in choppy, low-volume conditions — use zero-line positioning as a trend bias filter
- Risk management is non-negotiable: define stop-loss before entry and target a minimum 1.5:1 reward-to-risk on every trade
Frequently Asked Questions
What is the best MACD setting for day trading?
For most day traders using 15-minute charts, the standard MACD setting of (12, 26, 9) provides a solid balance between responsiveness and reliability. If you're scalping on 1-5 minute charts, consider faster settings like (5, 13, 4) to reduce lag. The key is matching your MACD parameters to your chosen timeframe — using slow settings on fast charts creates entries that are consistently too late to be profitable.
How do I confirm a MACD day trading signal?
The most effective confirmation method is combining MACD with RSI. When a MACD bullish crossover occurs and RSI is between 40-55 (with room to run before reaching overbought territory), the probability of follow-through increases substantially. Volume confirmation is equally important — a crossover backed by above-average volume carries significantly more weight than one on thin trading activity.
Is MACD divergence reliable for intraday trading?
MACD histogram divergence is one of the more reliable intraday signals available, particularly on 15-minute and 30-minute timeframes. It works best when confirmed by price action (like a rejection candle at resistance) and a supporting RSI divergence. On 1-minute charts, divergence signals are prone to noise and should be used with much greater caution. Our article on RSI divergence explores the confirmation framework that applies equally well to MACD divergence setups.
Can I use MACD alone for day trading without other indicators?
Technically yes — but it's not recommended. MACD alone generates too many false signals in ranging or choppy market conditions that are common intraday. Most professional day traders combine MACD with at least one confirming indicator (typically RSI or volume) and use price structure (support/resistance levels) as additional context. The combination dramatically improves signal accuracy and reduces costly whipsaw entries.
What timeframe works best for MACD day trading?
The 15-minute timeframe is widely considered the sweet spot for MACD-based day trading. It's fast enough to capture meaningful intraday moves but slow enough to filter out the random noise that plagues 1-minute and 5-minute charts. The 30-minute timeframe is also excellent for higher-conviction entries with fewer, but more reliable, signals. Many professional day traders use a multi-timeframe approach — checking the 30-minute for trend direction and the 15-minute for precise entry timing.