
What Is the MACD Histogram Strategy?
The MACD histogram strategy is one of the most powerful approaches to identifying momentum changes in financial markets. While most traders focus on the MACD line crossovers, the histogram — the vertical bars that represent the difference between the MACD line and the signal line — is where the real early warnings live. In 2026, with algorithmic trading dominating short-term price action, understanding how to read histogram compression, expansion, and divergence is more valuable than ever.
The MACD (Moving Average Convergence Divergence) indicator was developed by Gerald Appel in the late 1970s, but its histogram component has evolved into a standalone strategy tool for professional traders. When you understand what the histogram is actually telling you — before price confirms the move — you gain a significant edge in any market condition.
How the MACD Histogram Works: The Core Mechanics
Before applying the MACD histogram strategy, you need a solid understanding of how the histogram is constructed and what each bar represents.
The Three Components of MACD
- MACD Line: The difference between the 12-period EMA and the 26-period EMA
- Signal Line: A 9-period EMA of the MACD line itself
- Histogram: The visual representation of (MACD Line − Signal Line)
When the MACD line is above the signal line, the histogram prints positive (above zero). When the MACD line is below the signal line, the histogram prints negative (below zero). The size of each bar tells you how much momentum exists in that direction — and changes in bar size tell you whether momentum is accelerating or decelerating.
Key Insight: The histogram doesn't tell you the direction of price — it tells you the direction of momentum. A shrinking negative histogram bar means bearish momentum is fading, even if price is still falling. That's where the edge lies.
Reading Histogram Bar Changes: The Real Signal
Most trading education focuses on MACD line crossovers, which are lagging signals. The true power of the MACD histogram strategy comes from watching bar-to-bar changes:
- Growing positive bars: Bullish momentum is accelerating — trend following entries are valid
- Shrinking positive bars: Bullish momentum is fading — consider tightening stops or preparing for reversal
- Growing negative bars: Bearish momentum is accelerating — short positions or defensive posture
- Shrinking negative bars: Bearish momentum is fading — watch for bullish reversal setups
This framework alone — before adding any additional filters — gives you a momentum roadmap that price action alone cannot provide.
MACD Histogram Divergence: The High-Probability Setup
Divergence between price and the MACD histogram is the cornerstone of professional-grade MACD histogram strategy execution. This concept shares DNA with RSI-based divergence techniques — if you're familiar with RSI divergence, you'll find MACD histogram divergence intuitive, though it behaves somewhat differently due to the histogram's nature.
Bullish MACD Histogram Divergence
A bullish histogram divergence occurs when price makes a lower low, but the MACD histogram makes a higher low (the negative bar is less negative than the previous trough). This signals that while price is still declining, bearish momentum is losing strength.
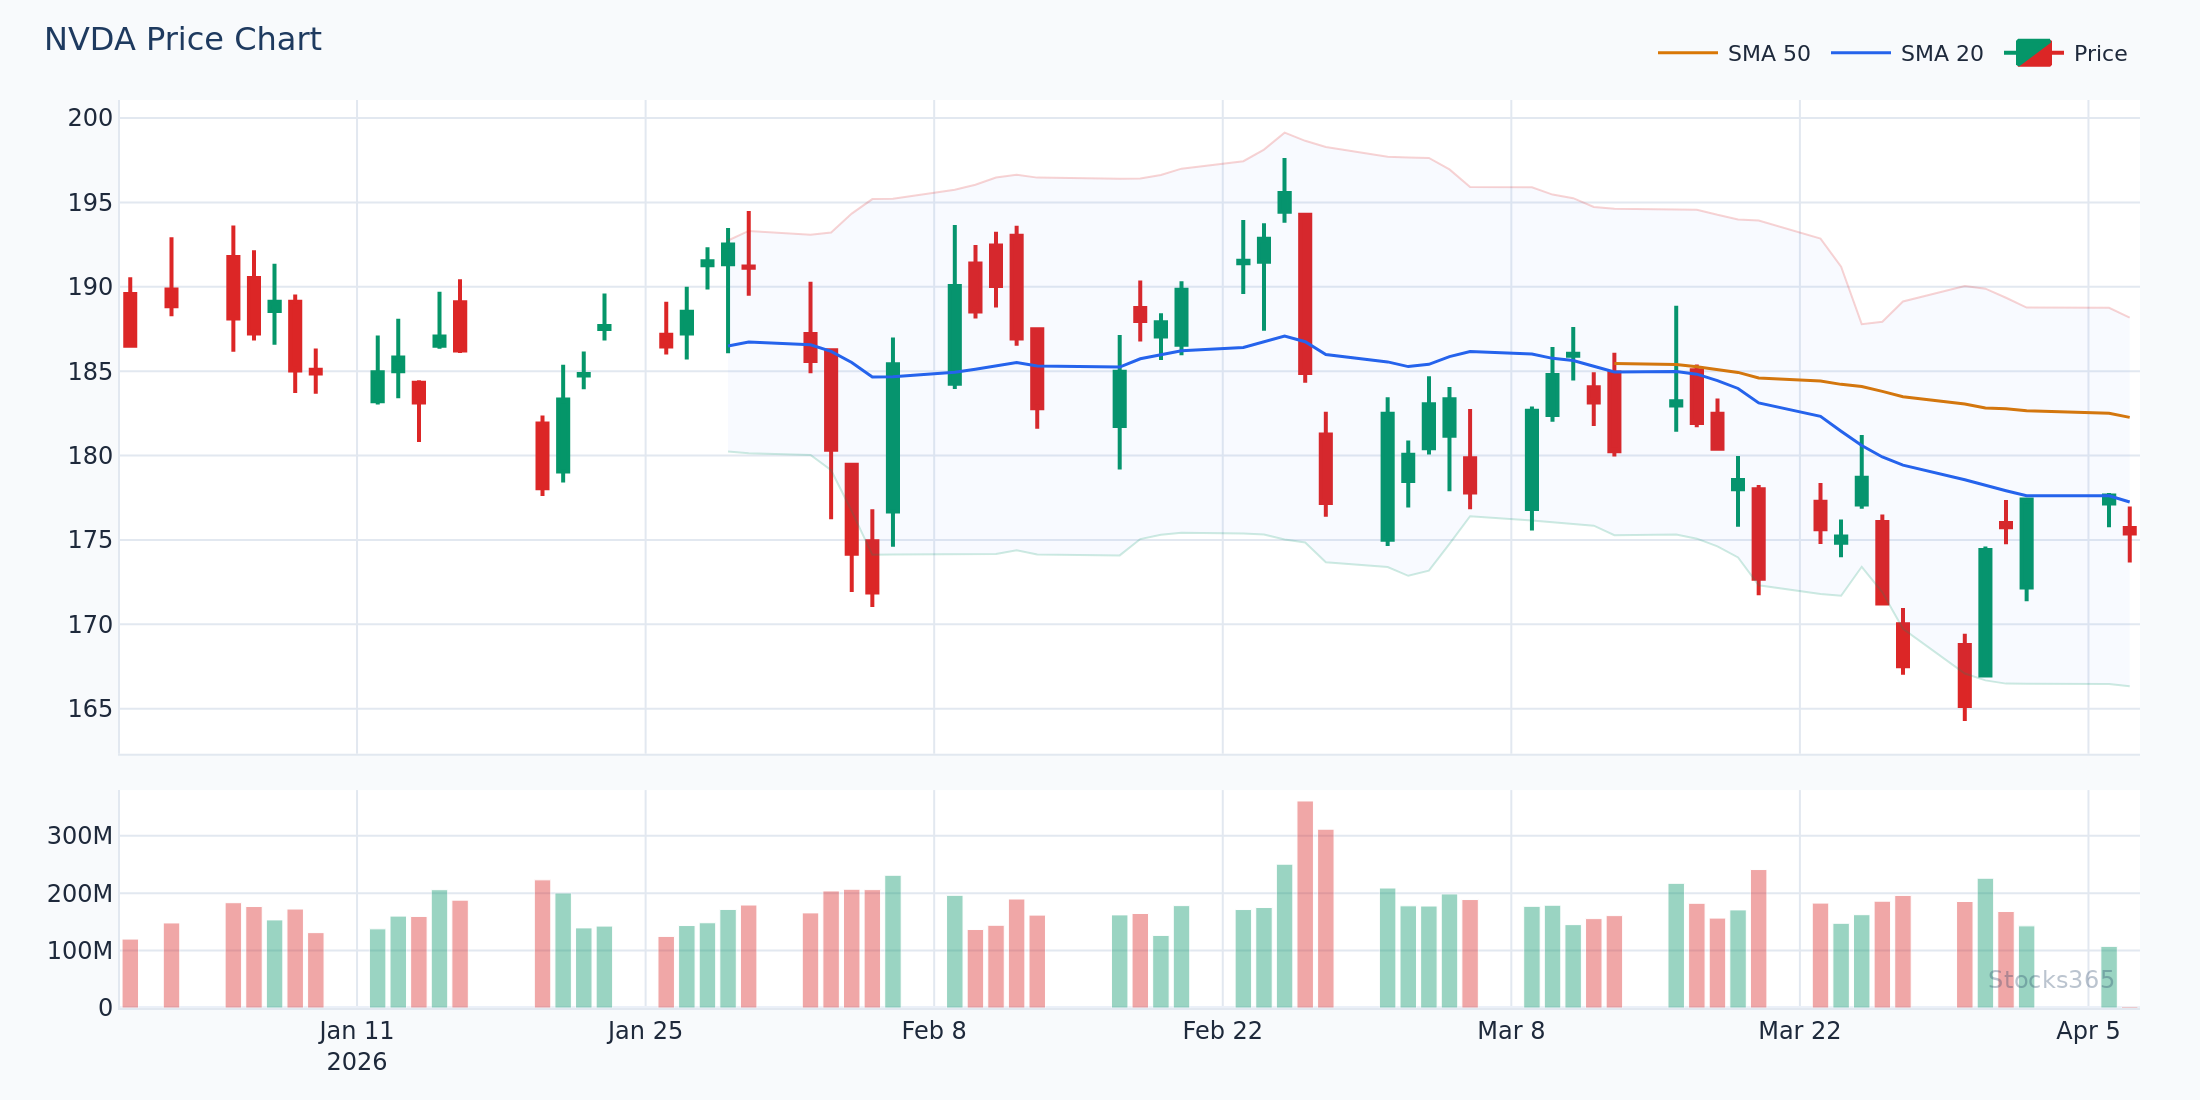
Practical Example — NVDA, February 2026: NVDA price declined from $142 to a low of $128, then pulled back before making a second low at $124. The first histogram low registered at -1.85, but the second low only reached -0.92 — a clear bullish divergence. Traders using the MACD histogram strategy entered long positions near $124.50 with a stop below $122. The subsequent rally carried price to $148 over the following three weeks.
Bearish MACD Histogram Divergence
The inverse applies at tops. Price makes a higher high, but the histogram makes a lower high (a smaller positive bar). This signals that while price is still rising, bullish momentum is exhausted.
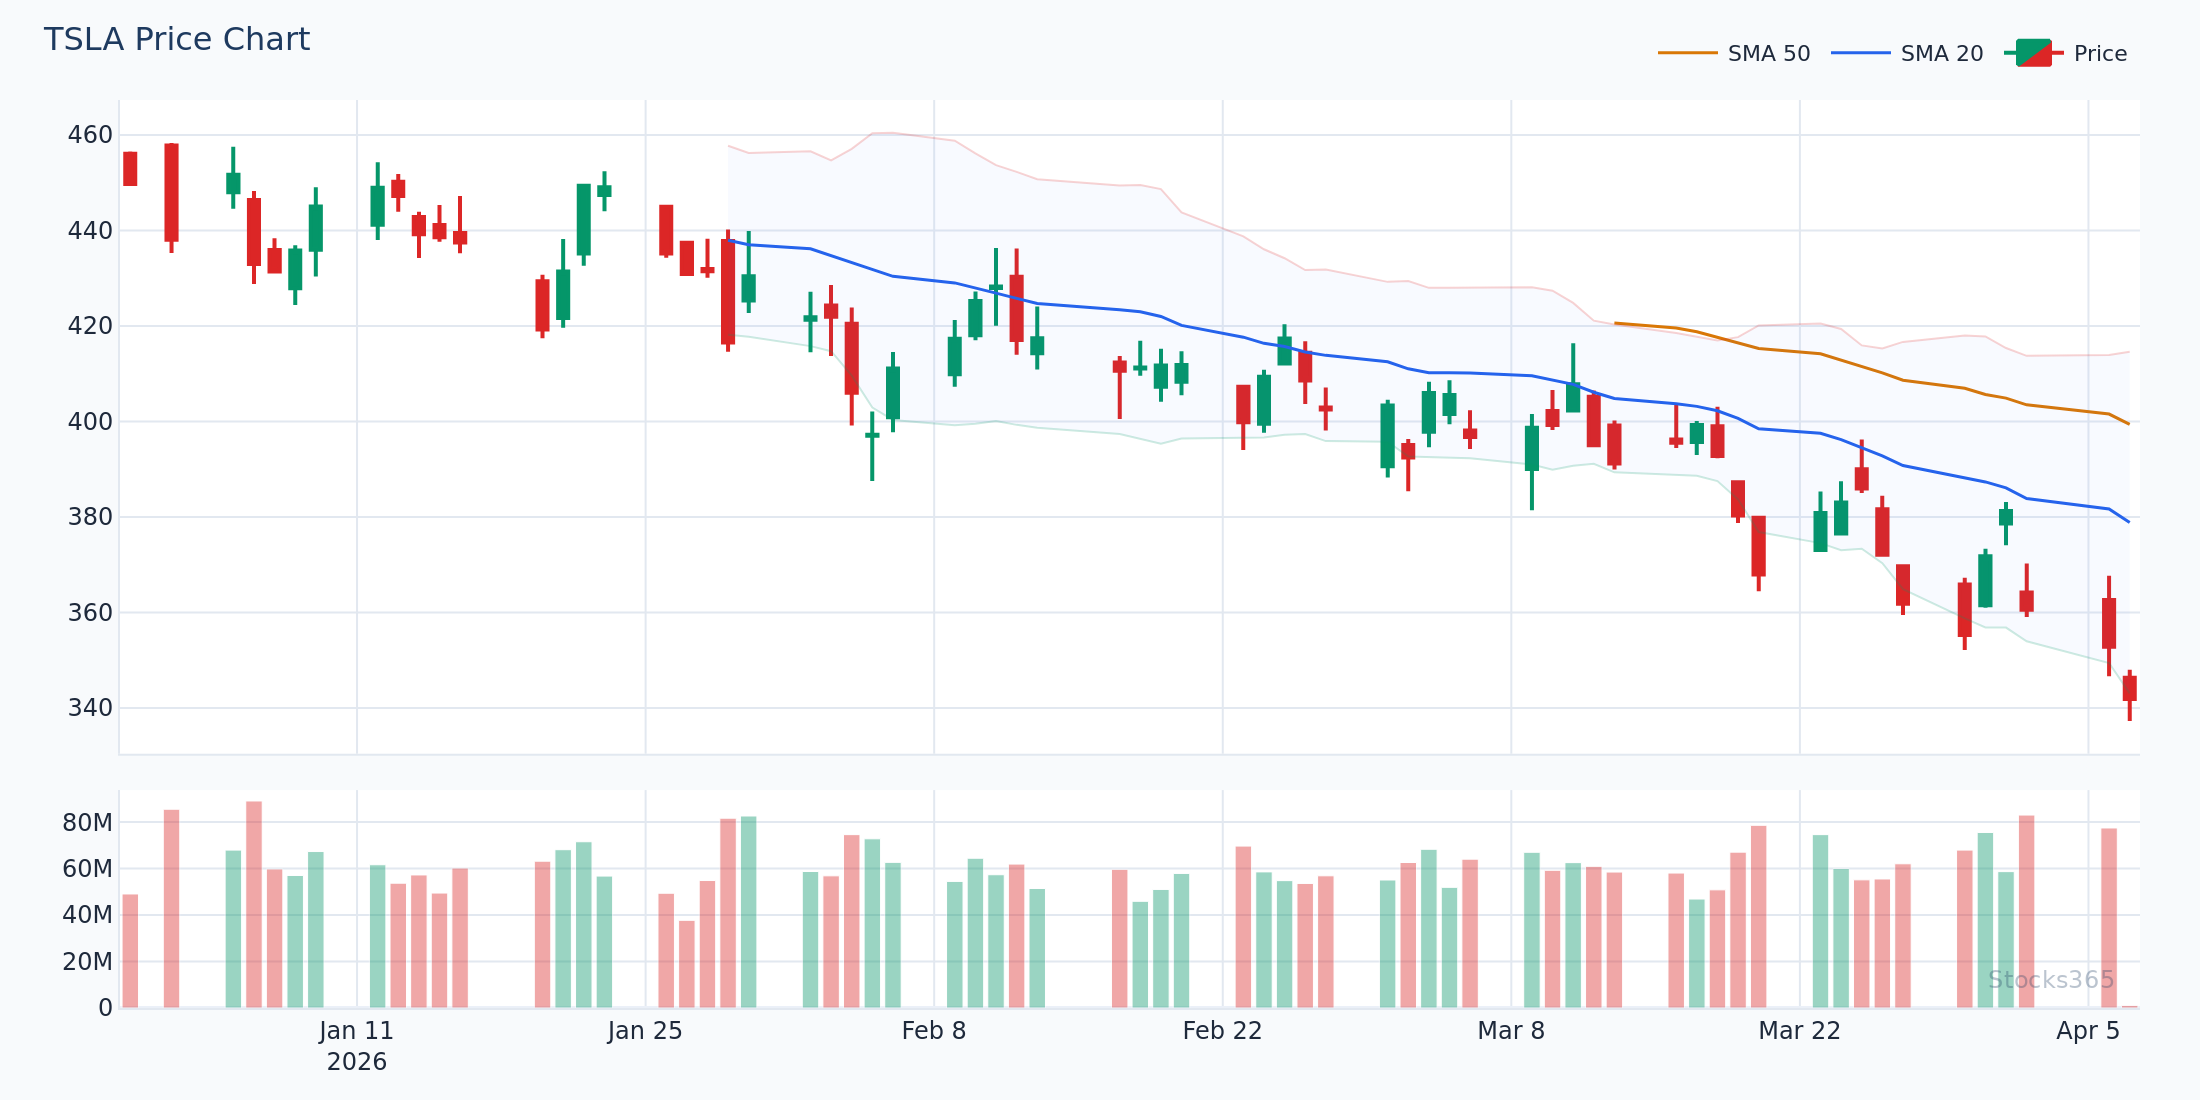
Practical Example — TSLA, March 2026: TSLA rallied from $210 to $248, pulled back, then made a new high at $255. The first histogram peak measured +2.10, but the second peak only reached +1.15 — a textbook bearish divergence. Short entries near $254 with stops above $260 yielded a $22 move lower as momentum finally buckled.
It's worth noting that divergence signals work across multiple timeframes. For a comprehensive approach to divergence analysis, including the more subtle hidden variety, explore our guide on hidden RSI divergence — the same hidden divergence concept applies to MACD histograms and can confirm trend continuation after pullbacks.
MACD Histogram Zero-Line Crossover Strategy
The zero-line crossover — when the histogram transitions from negative to positive or vice versa — represents the point where the MACD line crosses the signal line. While this is a slightly lagging signal compared to divergence plays, it offers higher reliability for trend-following strategies.
How to Trade Zero-Line Crossovers
- Bullish crossover (negative to positive): Enter long on the first positive bar, with a stop below the recent price swing low
- Bearish crossover (positive to negative): Enter short or exit longs on the first negative bar, with a stop above the recent price swing high
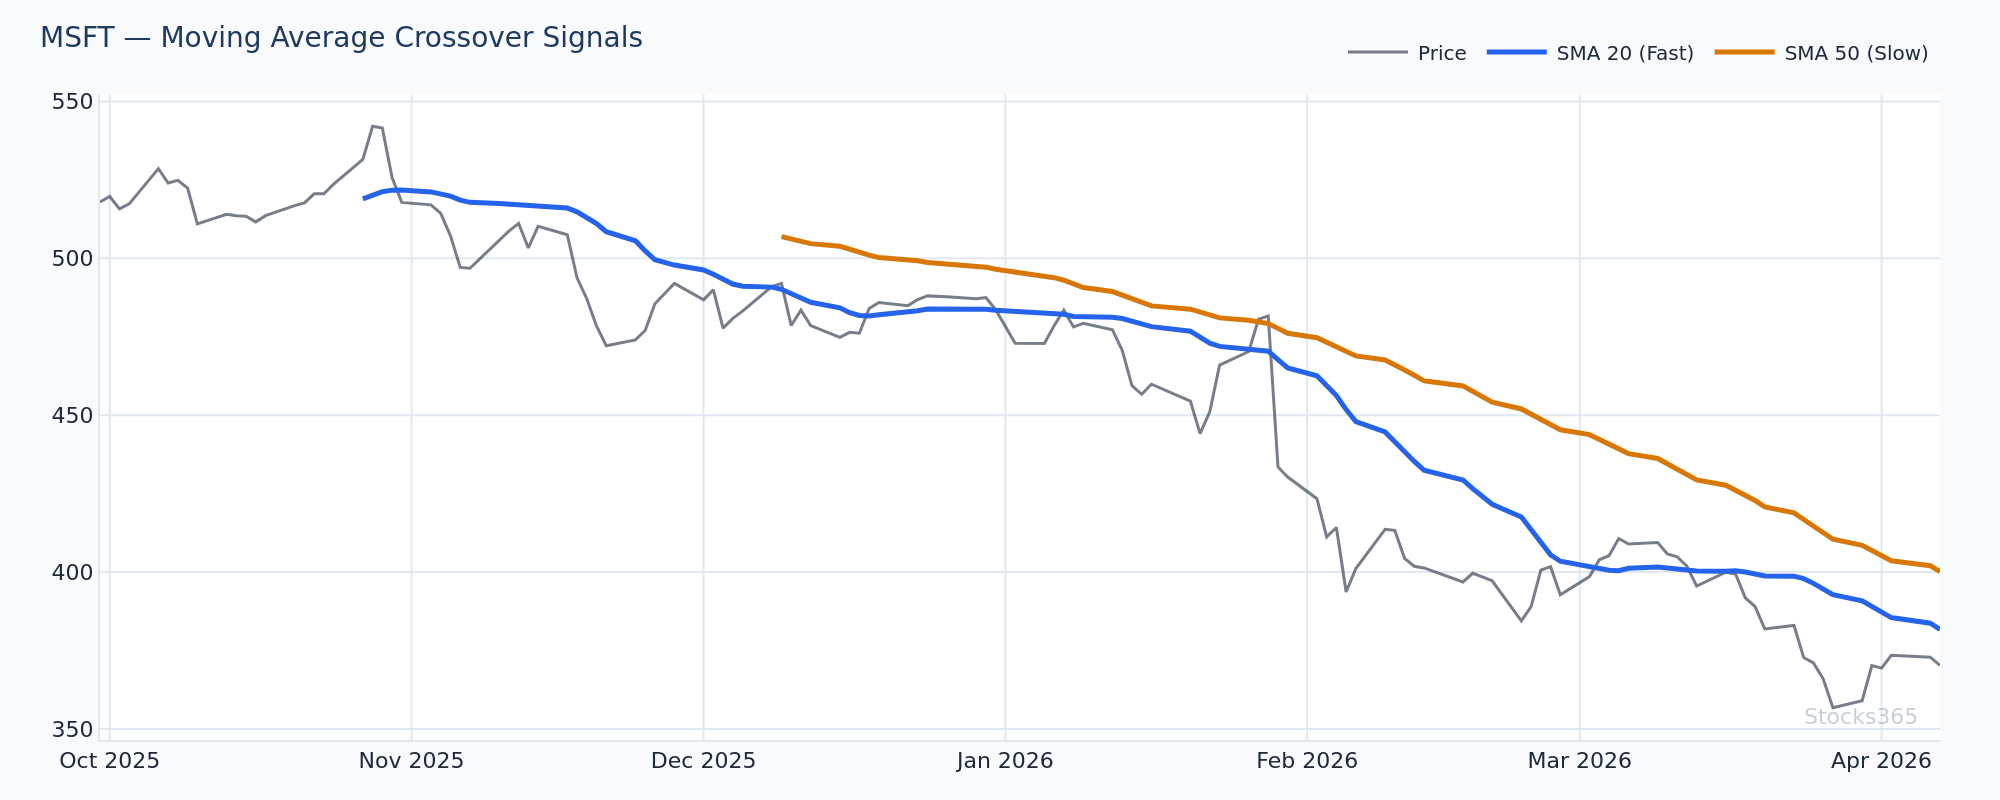
- Filter with trend: Only take bullish crossovers above the 50-day EMA, and only take bearish crossovers below the 50-day EMA
Pro Tip: A zero-line crossover that occurs while the histogram was already showing divergence is a two-confirmation signal and among the highest-probability setups in the MACD histogram strategy toolkit.
Combining the MACD Histogram Strategy with RSI
No indicator works in isolation. The most consistent application of the MACD histogram strategy comes from pairing it with momentum oscillators like the Relative Strength Index (RSI). The two indicators measure momentum differently, and their agreement — or disagreement — provides critical context.
The MACD + RSI Confirmation Framework
Here's how to build a multi-indicator confirmation system:
- Step 1: Identify a MACD histogram divergence signal (bullish or bearish)
- Step 2: Check RSI for confirmation — is RSI also showing divergence, or is it at an oversold/overbought extreme?
- Step 3: If both MACD histogram and RSI align, the setup has two-factor confirmation
- Step 4: Use price action (support/resistance, candlestick pattern) as the final trigger
Understanding RSI mechanics is foundational to this approach. If you need a refresher, our complete RSI guide covers everything from basic interpretation to advanced applications. For those who want to understand the mathematical underpinning, how RSI is calculated provides the formula explained step by step.
When MACD histogram divergence coincides with RSI reaching the 30 or 70 level, you're seeing momentum exhaustion confirmed by two independent measurements. This dramatically improves the reliability of the signal. Learn more about reading those extreme RSI levels in our dedicated article on RSI overbought and oversold signals.
Timeframe Alignment: The Multi-Timeframe MACD Approach
Professional traders using the MACD histogram strategy rarely look at a single timeframe. The framework is:
- Higher timeframe (Daily/Weekly): Establishes trend direction and identifies major divergences
- Intermediate timeframe (4H/Daily): Identifies your primary trade setup using histogram analysis
- Lower timeframe (1H/4H): Provides the precise entry trigger using histogram zero-line crossovers
This top-down approach ensures you're trading histogram signals in the direction of the larger momentum trend, filtering out counter-trend trades that historically carry lower win rates.
MACD Histogram Squeeze: Reading Consolidation Before Breakout
One of the most underutilized aspects of the MACD histogram strategy is the histogram squeeze — a period where the bars become progressively smaller, indicating that the market is in balance and a momentum breakout is imminent.
Identifying and Trading the Histogram Squeeze
A histogram squeeze occurs when:
- The histogram bars are shrinking for 3 or more consecutive bars
- The bars are approaching (but not necessarily crossing) zero
- Price is consolidating in a relatively narrow range
The trade setup involves waiting for the squeeze to resolve: the first expanding bar (larger than the previous bar) in either direction signals the beginning of a new momentum impulse. Entry is taken in the direction of the expansion, with a stop below/above the consolidation range.
Practical Example — AMZN, April 2026: AMZN traded between $198 and $205 for eight sessions. During this time, the MACD histogram compressed from bars of ±0.80 down to ±0.18. On the ninth session, a positive bar of 0.42 printed — more than double the previous bar. Momentum breakout traders entered at $204.20 with a stop at $199.50. AMZN extended to $218 over the next 12 days.
Risk Management in MACD Histogram Trading
Even the best MACD histogram strategy fails without disciplined risk management. Here are the principles that separate profitable histogram traders from those who give back their gains:
Position Sizing and Stop Placement
- Never risk more than 1-2% of account per trade — histogram divergences can take time to resolve, and premature entries require room to breathe
- Place stops beyond the structural level — for bullish divergence entries, stop goes below the price low, not just below entry
- Scale entries — take a partial position on the first confirmation signal, add on the zero-line crossover for a full position
When MACD Histogram Signals Fail
No strategy is infallible. MACD histogram signals tend to fail in the following conditions:
- Strong trending markets: In powerful trends, bearish divergences can persist for many bars before price corrects — trend is more powerful than momentum exhaustion
- News-driven moves: Earnings releases, Fed announcements, or macro events can override technical signals instantly
- Low liquidity environments: Thinly traded securities produce false histogram signals due to erratic price action
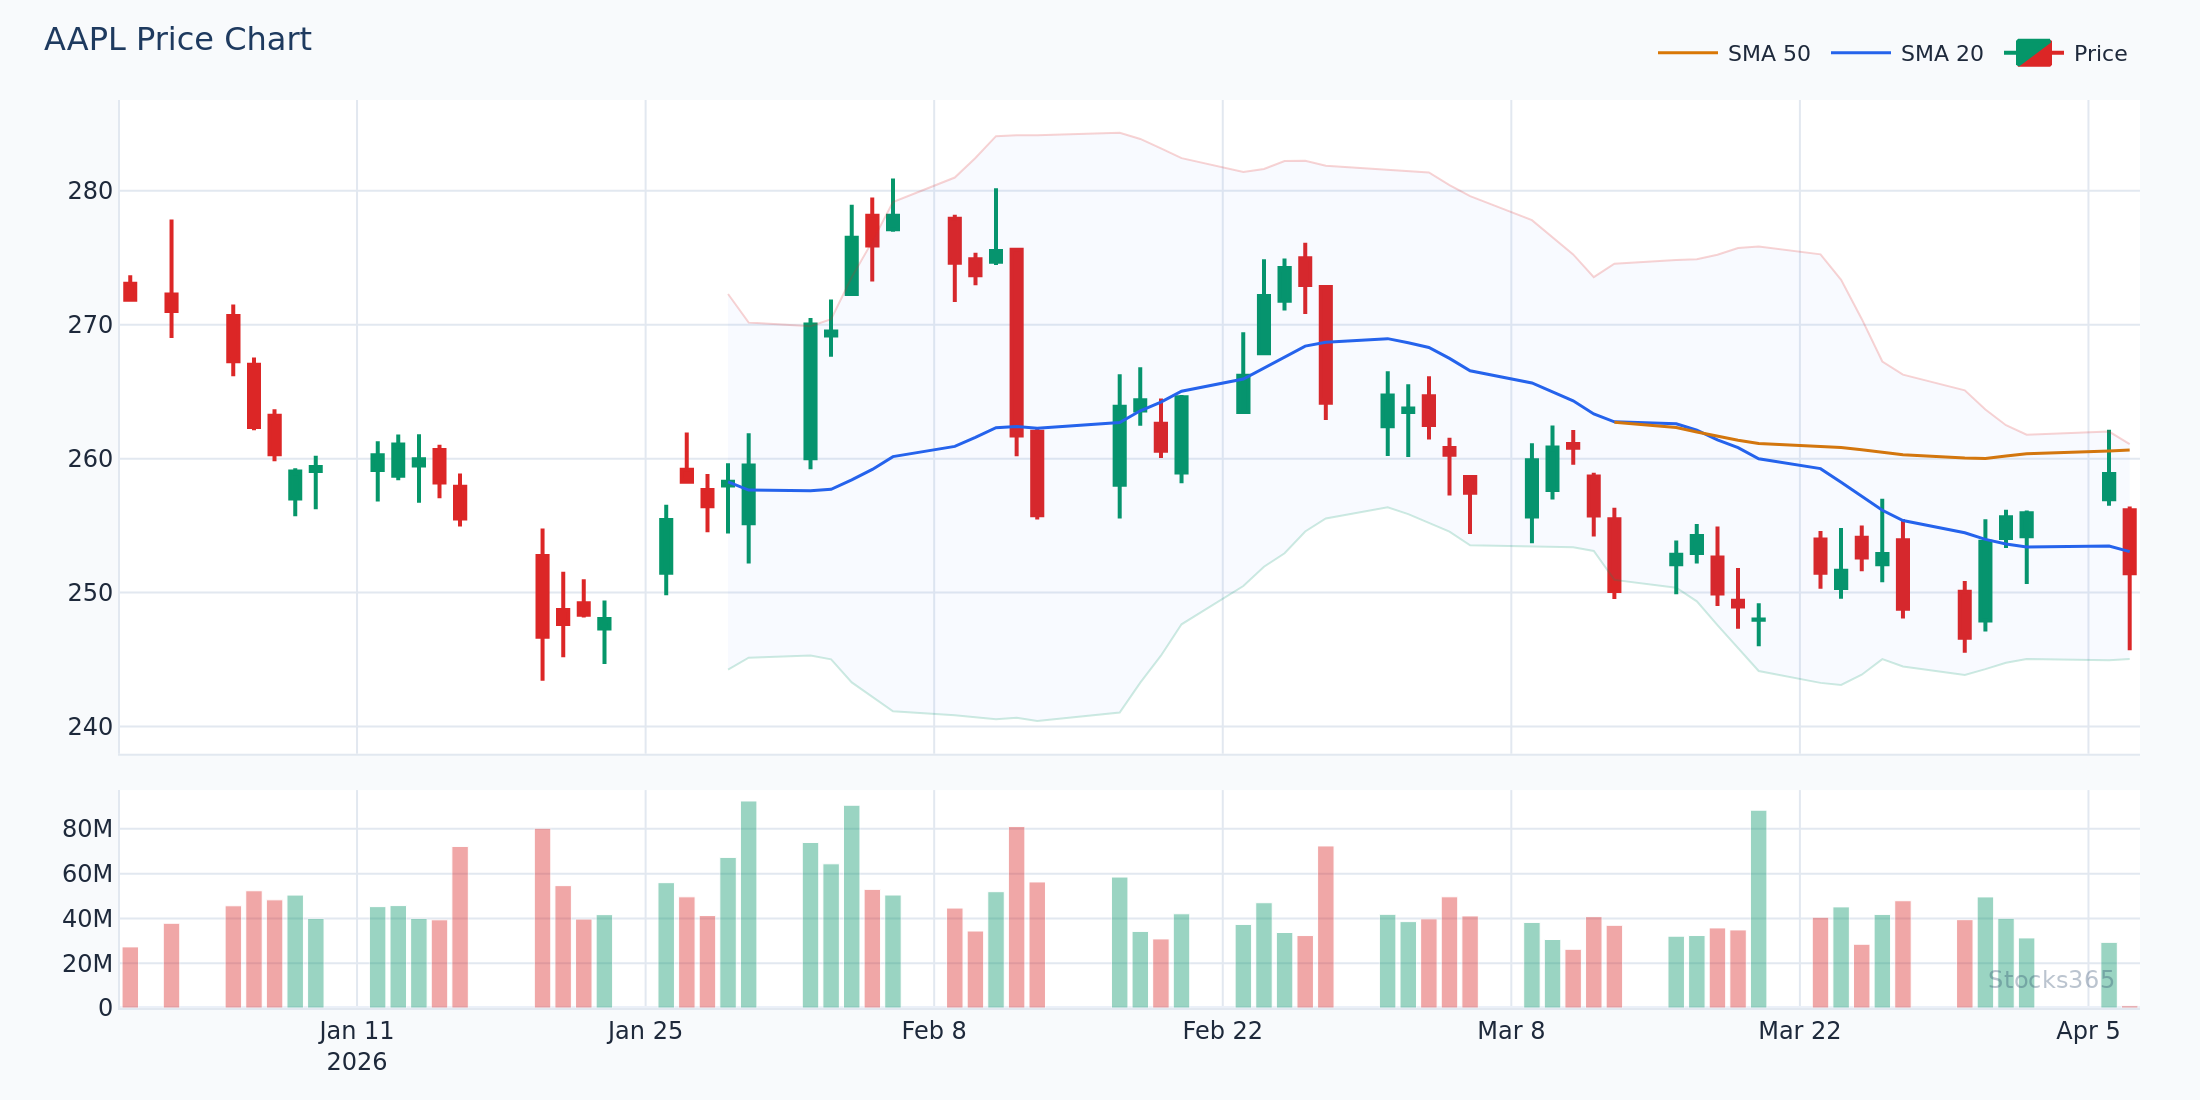
Using the Stocks365 signals dashboard alongside your MACD histogram analysis can help you filter these risk scenarios. The platform's trust score system evaluates signals based on multiple factors — when a histogram-based trade setup aligns with a high trust score signal on actively traded stocks like AAPL, the probability of a successful outcome improves significantly because you're combining technical momentum analysis with institutional-grade signal validation.
Optimizing MACD Settings for Different Markets
The standard MACD settings (12, 26, 9) were designed for daily stock charts. In 2026's multi-asset trading environment — where traders operate across equities, crypto, forex, and futures — adjusting settings for your specific market and timeframe can enhance histogram signal quality.
Recommended MACD Settings by Market Type
- Daily equity charts: 12, 26, 9 (standard — well-tested across decades)
- Intraday (1H-4H) equity/ETF: 8, 21, 5 (faster response, more signals)
- Weekly swing trading: 12, 26, 9 or 19, 39, 9 (smoother histogram, fewer false signals)
- Crypto (24/7 markets): 12, 26, 9 on 4H charts or 8, 17, 9 for faster signals
The principle mirrors what we discuss in our guide on RSI settings optimization — shorter periods generate more signals with more noise, while longer periods generate fewer but more reliable signals. Align your MACD histogram settings to your holding period and risk tolerance. For a broader comparison of momentum indicators and their settings, our RSI vs Stochastic guide offers useful context on how different momentum tools approach the same problem.
Building a Complete MACD Histogram Trading Plan
The best traders don't just know setups — they have a systematic plan. Here's a repeatable framework for applying the MACD histogram strategy consistently:
Step-by-Step MACD Histogram Trade Process
- Scan for divergence: On your chosen timeframe, identify stocks where price and MACD histogram are diverging at swing highs or lows
- Confirm with secondary indicators: Check RSI levels and trend direction. Our step-by-step RSI trading guide pairs naturally with this process
- Wait for confirmation: Don't anticipate — wait for the histogram to show a reversal bar (first bar moving against the divergence direction)
- Enter with defined risk: Set your stop at the structural level, calculate position size based on your 1-2% risk rule
- Manage the trade: Use expanding histogram bars in your favor as a signal to hold; use shrinking bars as a warning to tighten stops
- Exit with discipline: Exit when the histogram shows signs of momentum exhaustion again, or when price reaches your predefined target
Key Takeaways
MACD Histogram Strategy — Summary
- The histogram measures the gap between the MACD line and signal line — changes in bar size reveal momentum acceleration or deceleration
- Histogram divergence (price vs. histogram making opposite highs/lows) is a leading signal for momentum reversals
- Zero-line crossovers provide confirmed momentum direction changes — combine with divergence for highest-probability setups
- Histogram squeezes signal consolidation before breakout — trade the expansion, not the compression
- Always confirm MACD histogram signals with secondary tools like RSI and price structure
- Adjust MACD settings (12,26,9 standard) based on your market type and trading timeframe
- Risk management — 1-2% per trade, stops at structural levels — is as important as signal quality
- Use the Stocks365 trust score and signals platform to validate setups before committing capital
Frequently Asked Questions
What is the MACD histogram and how is it different from the MACD line?
The MACD line shows the difference between two exponential moving averages (typically 12 and 26 periods). The MACD histogram goes one step further — it measures the difference between the MACD line and its signal line (a 9-period EMA of the MACD line). While the MACD line tells you trend direction, the histogram tells you whether that trend's momentum is strengthening or weakening. The histogram is the more sensitive, faster-reacting component and is the basis of advanced MACD histogram strategy techniques.
Is MACD histogram divergence more reliable than MACD crossover signals?
In most market conditions, yes. MACD crossovers are confirmed signals — they occur after momentum has already shifted. Histogram divergence, by contrast, appears before the crossover, giving you earlier warning. However, earlier signals also carry more false positives. The best approach combines both: use divergence to identify the potential setup, and use the zero-line crossover as the confirmation trigger. This two-step process filters out many false signals while still getting you into the move before the late majority.
What are the best markets and timeframes for the MACD histogram strategy?
The MACD histogram strategy works across equities, ETFs, forex, commodities, and crypto. For equity traders, the daily and 4-hour charts using standard 12,26,9 settings offer the best balance of signal frequency and reliability. Intraday traders on 1H charts can use faster settings like 8,21,5. Swing traders on weekly charts can use 19,39,9 for cleaner signals. The key is consistency — choose your timeframe and settings based on your holding period and test them systematically before trading real capital.
How do I avoid false MACD histogram signals in trending markets?
Trending markets are where the MACD histogram strategy generates the most false reversals, particularly bearish divergences in a strong uptrend. To filter these, always check the higher timeframe trend direction first — only take divergence signals that align with or are neutral to the larger trend. Additionally, require that divergence signals coincide with a significant price support or resistance level. A bearish histogram divergence at a major resistance level carries far more weight than one occurring in the middle of a clean uptrend with no structural reason for reversal.
Can I use the MACD histogram strategy with other technical indicators?
Absolutely — and you should. The MACD histogram strategy is most powerful as part of a multi-indicator confirmation framework. RSI is the most natural companion: when MACD histogram divergence aligns with RSI divergence or extreme overbought/oversold readings, setup quality increases substantially. Volume indicators also add value — a bullish histogram divergence accompanied by declining selling volume is a stronger signal than divergence alone. Bollinger Band squeezes often coincide with MACD histogram squeezes, making them natural partners for breakout setups. The goal is confirmation from independent measurements, not redundancy from correlated indicators.